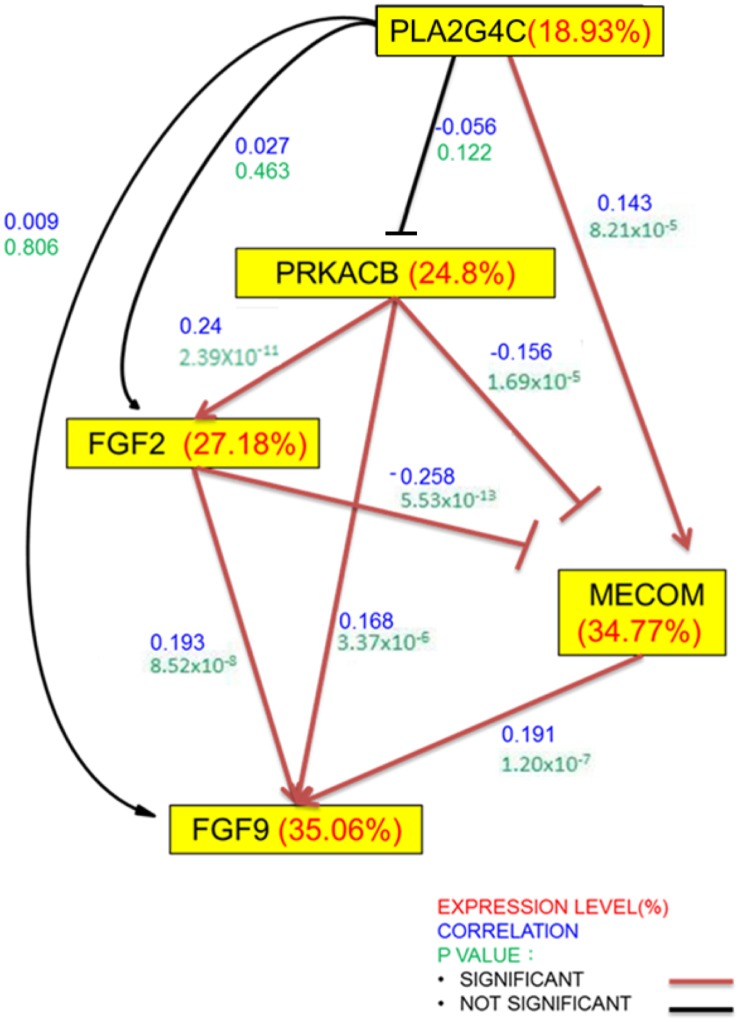
Fig 6. Gene expression correlation of the genes involved in the MAPK pathway in the CRC tumor samples from the TCGA data base.
The pooled microarray datasets downloaded from NCBI were used to identify the relationship of these candidate genes. The genes in the upstream of the network were assumed to be less variant, so coefficient of variation (CV) of each gene (presented in percent) was calculated to determine its site in the regulatory network. Besides, Spearman’s rank correlation coefficients (-1 to 1) of the desired gene pairs decide whether they were negative/positive control with significance level p<0.05. Number of patients = 653. The red lines or arrows represent significant correlation (P-value <0.05). Coefficient of variation in red, correlation coefficient in blue and P-value in green.

