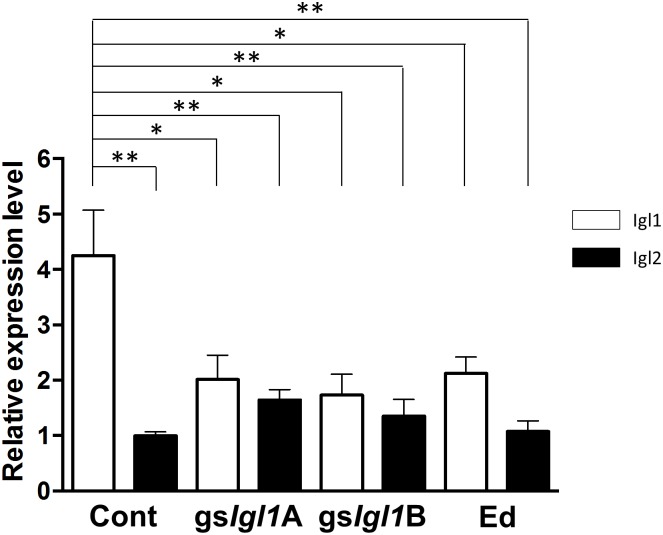
Fig 5. Real-time PCR analysis of Igl genes from E. histolytica and E. dispar.
Expression levels of Igl1 (open bars) and Igl2 (filled bars) in trophozoites from E. histolytica strain with an empty vector (Cont), E. histolytica gsIgl1 strains (gsIgl1A and gsIgl1B) and E. dispar SAW1734RclAR strain (Ed) were compared using actin as an internal standard. Expression levels are shown as values relative to the mean expression level of Igl2 from Cont. Vertical bars indicate the S.E. of the mean from 3 experiments. *p< 0.05, **p< 0.01 by ANOVA with Dunn test.

