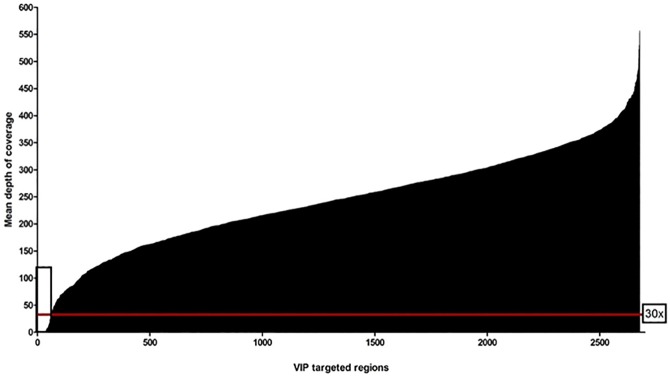
Fig 1. Depth of coverage.
Representative depth-of-coverage (DoC) plot for all 72 (16x-multiplexed/run) captured samples using QXT targeted enrichment kit and 2 x 150 bp paired-end sequencing on Illumina Miseq. The captured regions are ordered according to mean DoC. Red line represents 30x DoC level while the rectangular box indicated 2.2% of the targeted regions with <30x values (mean 5, range 0–25), including regions with no mapped reads.

