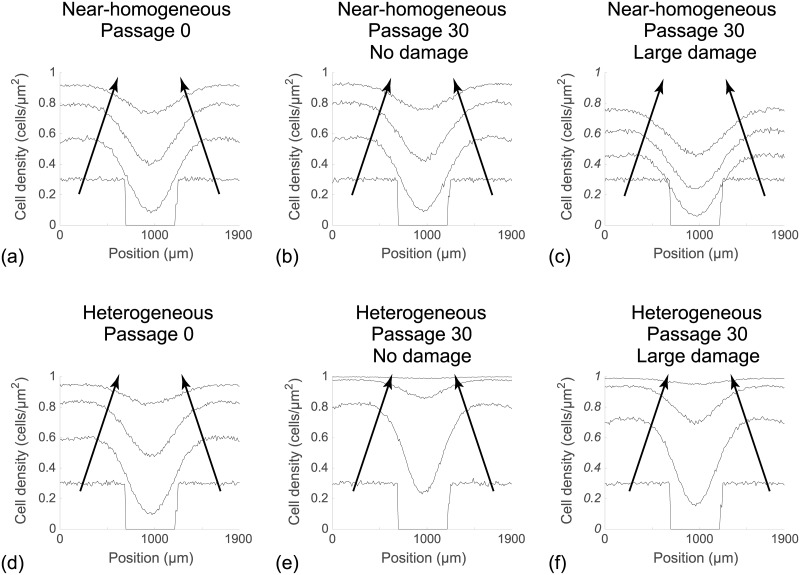
Fig 8. Averaged simulation data showing cell density profiles from the scratch assays.
(a)–(c): Cell density profiles for a near–homogeneous cell line. (d)–(f): Cell density profiles for a heterogeneous cell line. In each subfigure cell density profiles are given at t = 0, 24, 48, 72 h, and the direction of increasing t is shown with the arrows. All simulation results are averaged across 100 identically prepared realisations of the discrete model, with Δ = 24 μm, τ = 1/12 h, and Pm = 0.35, on a lattice of size 80 × 68. In each subfigure the initial Pp of individual cells is assigned by randomly selecting from the corresponding in silico data in Figs 2f, 2h, 2x and 3f, 3h and 3x, respectively.

