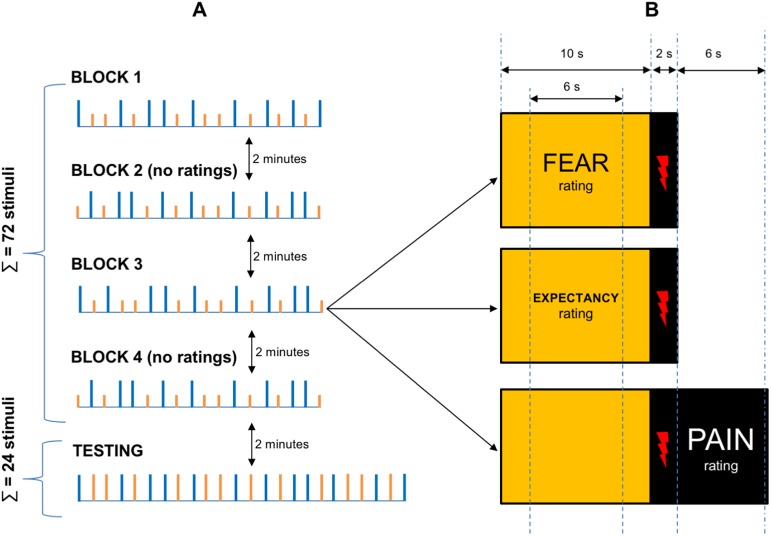
Fig 2. Details of the study design using an example of the placebo group with an orange light serving as a placebo.
Part ‘A’ depicts the time-course of the procedure: there were four blocks of conditioning trials, two of them with pain, expectancy, and fear ratings (Blocks 1 and 3), and two without any ratings (Blocks 2 and 4). Each conditioning block consisted of 18 electrical stimuli. After the conditioning phase was completed, the testing phase consisting of 24 electrical stimuli began. Orange lights (orange vertical bars) served as placebo stimuli (nonpainful intensity, i.e. [t + 0.8 × (T—t)] mA), while blue lights served as control stimuli (painful intensity, i.e. 1.5 × T mA). During the testing phase, the stimuli of the same painful intensity (i.e. 1.5 × T mA) were applied, regardless of the colour of the preceding light. Part ‘B’ depicts the design of single a trial: a colour light was presented for 10 seconds. For each block, one-third of the lights was displayed with the NRS for the expectancy rating, one-third was displayed with the NRS for the fear rating and one-third was displayed without any scale. In the latter case, a slide with the NRS for pain intensity rating was shown for another 6 sec immediately after the electrical stimulus (depicted by red lightning) was applied.

