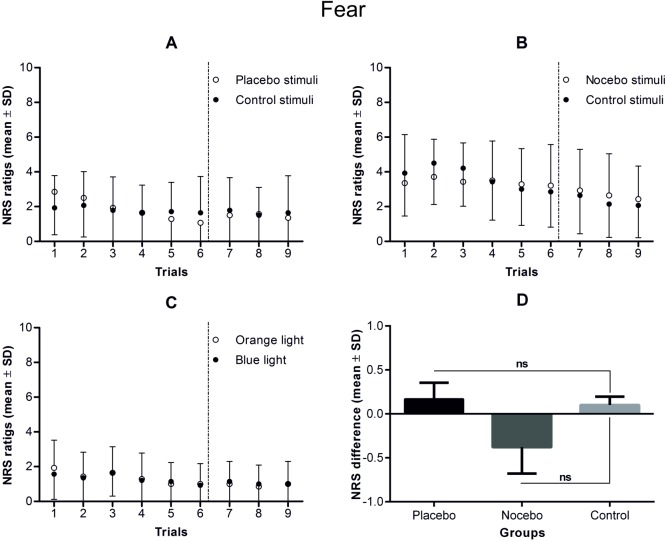
Fig 5.
Fear ratings during the conditioning and testing phases in the placebo (A), nocebo (B) and control group (C). Note that although the conditioning phase consisted of 72 electrical stimuli, which were divided into 4 blocks of 18 stimuli, the participants rated fear in only one-third of the trials during the first and the third blocks of stimuli. Fear was rated 6 times during the testing phase of the study (separated by vertical dotted lines), which consisted of 24 control stimuli. The mean differences in fear during the testing phase of the study in each of the study groups are presented in part D of the figure. There were no statistically significant differences in fear either within or between study groups in the testing phase.

