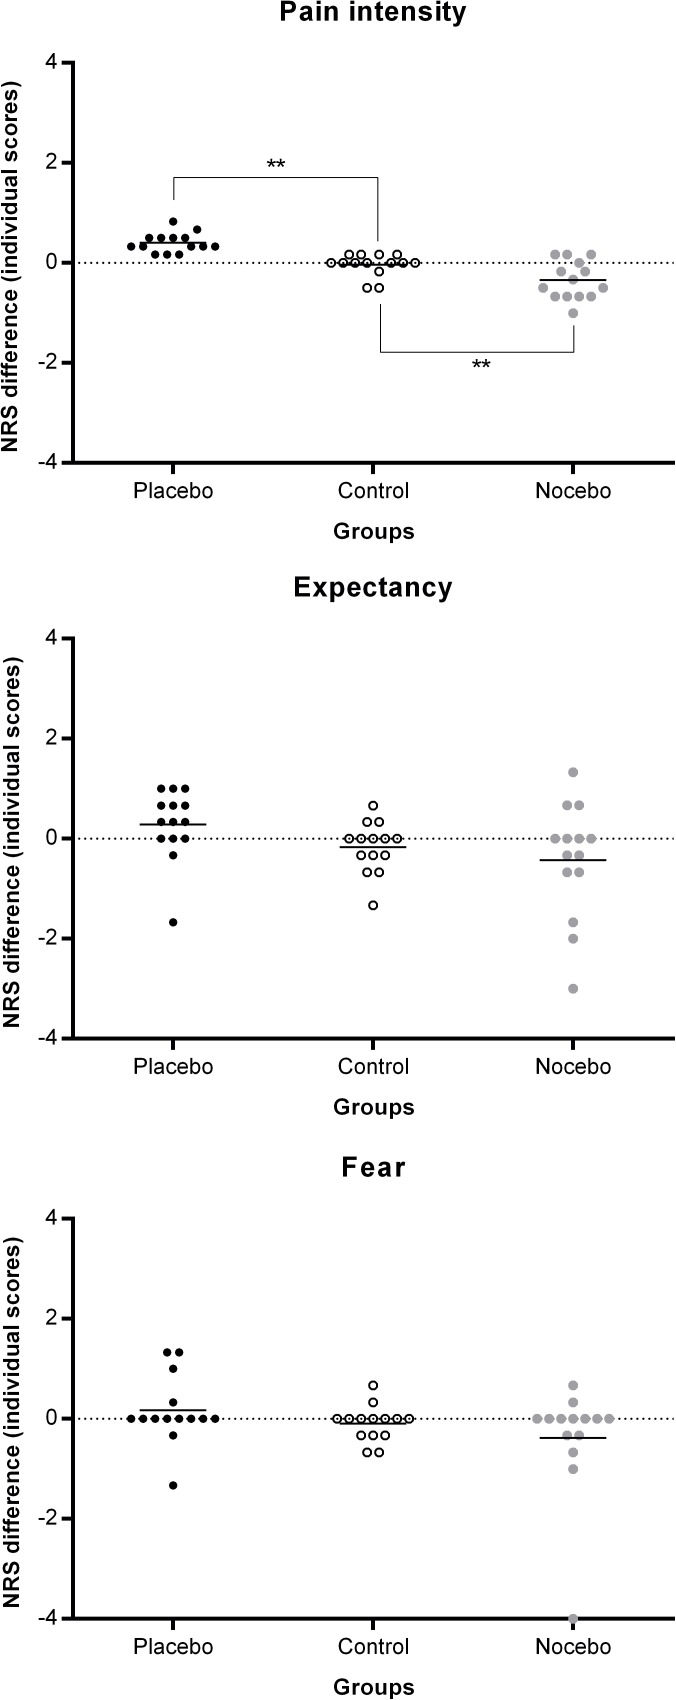
Fig 6. Mean differences (horizontal bars) in pain intensity, expectancy and fear during the testing phase of the study.
Individual scores were plotted to show data distribution. In the testing phase, the differences in pain intensity in the placebo and nocebo groups were significantly higher than in the control group. * p < 0.01, ** p < 0.001.

