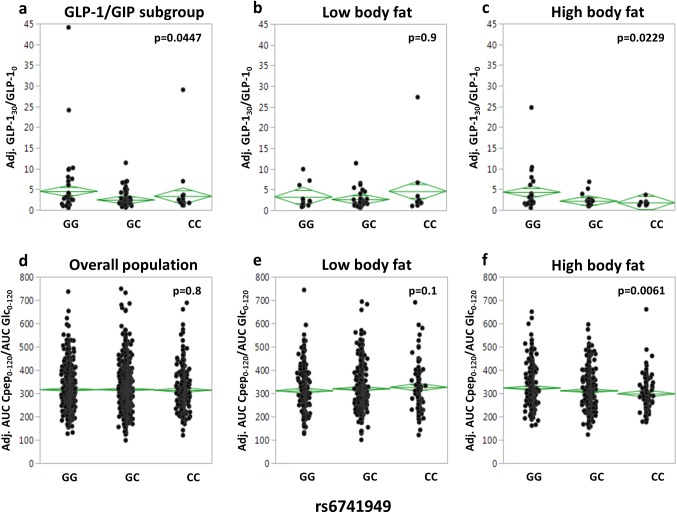
Fig 2. Association of DPP4 SNP rs6741949 with GLP-1 levels and insulin secretion during an OGTT.
GLP-1 levels (a-c) are presented as ratio of GLP-1 at 30 min of the OGTT divided by GLP-1 at baseline adjusted for gender, age, and, in the unstratified subgroup, bioimpedance-derived percentage of body fat. Insulin secretion (d-f) is presented as ratio of AUC C-peptide during the complete 2-h OGTT divided by AUC glucose (x10-9) adjusted for gender, age, OGTT-derived insulin sensitivity, and, in the unstratified overall population, percentage of body fat. For stratification, the population was divided into quintiles of percentage of body fat. The lowest two quintiles were combined to form the low body fat group (b and e), the highest two quintiles to form the high body fat group (c and f). The middle quintile was excluded. Individual data and mean diamonds (green) are plotted. The top and the bottom of the mean diamond mark the 95% confidence interval; the mean line across the middle of the diamond represents the group mean; and the lines above and below the group mean represent overlap marks. AUC–area under the curve; GLP-1 –glucagon-like peptide 1; OGTT–oral glucose tolerance test; SNP–single nucleotide polymorphism.

