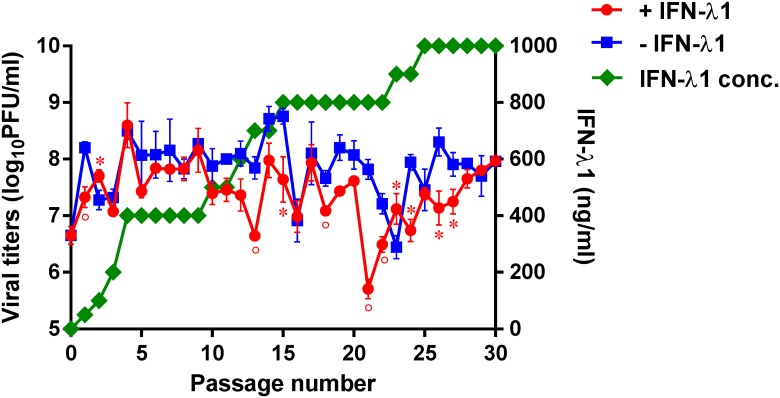
Fig 1. Generation of influenza A viruses with decreased sensitivity to IFN-λ1.
A/California/04/09 virus was passaged in Calu-3 cells in the presence (red line) or absence (blue line) of increasing concentrations of IFN-λ1 (green line). *P < 0.05, °P < 0.01, compared to the values for the CA/04–IFN-λ1 virus.

