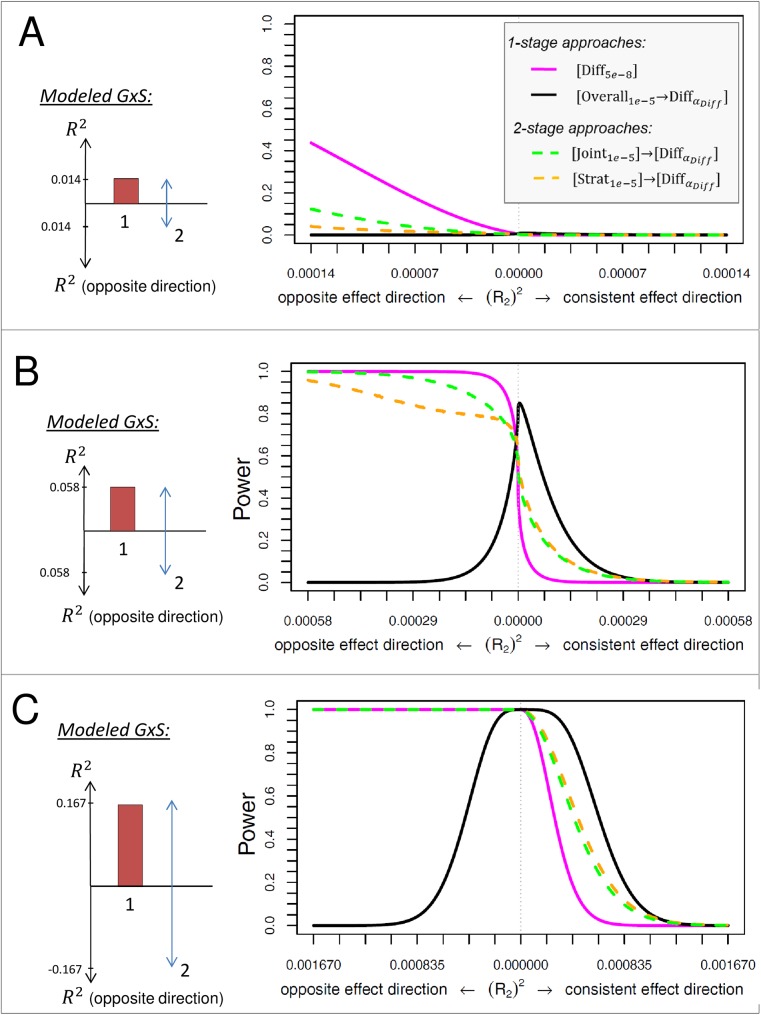
Fig 2. Power of stratified GWAMA approaches to identify GxS for balanced strata design.
Shown is the power to detect GxS in equally sized strata (n1 = 100,000, n2 = 100,000) for each of the considered approaches, for varying effect sizes in stratum 2, , with a fixed genetic effect in stratum 1, , that is (A) small (), (B) medium (), or (C) large (). The effect sizes for are chosen as those observed for WHRadjBMI near STAB1, PPARG or LYPLAL1, respectively. The modeled GxS are visualized on the left side (red bar: , blue arrows: varying ). For the difference test without filtering, we assume a significance level at 5 x 10⁻⁸; for approaches with filtering, the filtering threshold is 1 x 10⁻⁵ and the significance level applied for the consecutive difference test is αDiff = M/0.05, with M being the number of filtered lead variants (see Methods).

