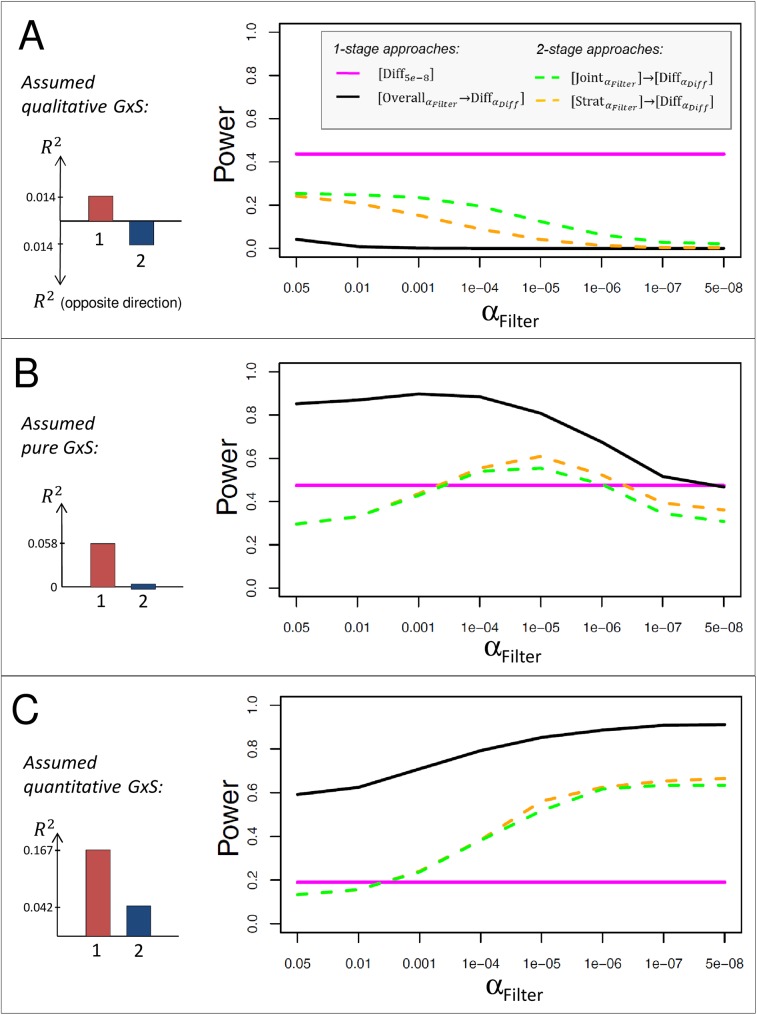
Fig 3. Influence of filtering threshold on the power to detect GxS.
Shown is the power to detect GxS for the same approaches as in Fig 2 (n1 = 100,000, n2 = 100,000), but here with varying filtering thresholds and fixed relative to for different types of GxS: A. qualitative GxS with small stratum-specific effects ( into opposite direction), B. pure GxS with medium sized stratum 1 effect (), and C. quantitative GxS with large stratum 1 and smaller stratum 2 effect ( into the same direction). The effect sizes for stratum 1 are chosen as those observed for the WHRadjBMI loci around STAB1, PPARG, or LYPLAL1. The power of [Diff5e-8] is constant due to the lack of any filtering.

