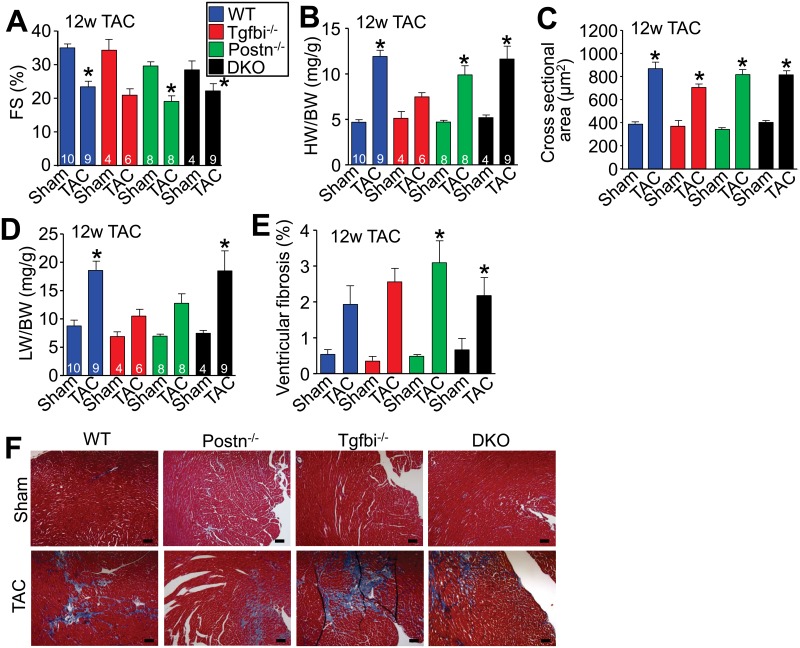
Fig 3. Loss of Tgfbi does not appreciably alter disease progression after long-term TAC.
(A) Percent ventricular fractional shortening as measured by echocardiography 12 weeks after TAC in the indicated groups. *p<0.05 vs sham-operated controls. (B) Heart-weight normalized to body-weight in the indicated groups of mice after 12 weeks of TAC. *p<0.05 vs sham-operated controls. (C) Cardiomyocyte cross-sectional area from ventricular histological sections in the indicated groups of mice 12 weeks after MI. *p<0.05 vs sham-operated controls. Four to six hearts were processed from each group, with at least 3 fields analyzed per histological section. (D) Lung-weight normalized to body-weight in the indicated groups of mice 12 weeks after TAC. *p<0.05 vs sham-operated controls. (E) Ventricular fibrosis from Masson's trichrome-stained histological images in the indicated genotypes of mice after 12 weeks of TAC. *p<0.05 vs sham-operated controls. Four to six hearts were processed from each group, with at least 3 fields analyzed per histological section. (F) Representative Masson’s trichrome-stained histological heart sections from sham and TAC hearts after 12 weeks of MI. Images were taken at 100x magnification. Scale bar = 100 μm. All statistical analyses were performed using a parametric one way ANOVA with a Newman-Keuls post-hoc test.

