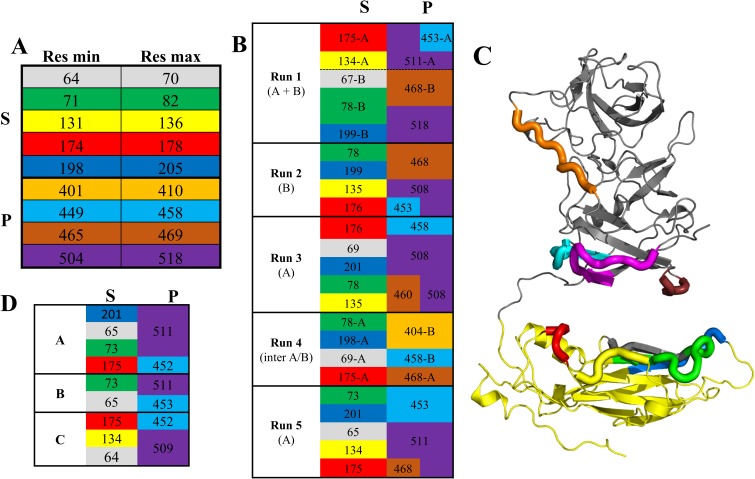
Fig 6. Segments of S and P domains interacting with one another.
(A) Limits of amino acid segments found in S (top) interacting with P or in P (bottom) interacting with S in any of the 5 simulations of Fig 5. Each segment is associated with a color kept in the rest of the figure. (B) Interactions between segments in all simulations. Interacting segments between S (left) and P (right) are presented on the same line. The segment's residue indicated is the one with the strongest and/or most frequent interaction (S4 Fig). Chains are indicated as needed (run 1, where both chains have S-P interactions; run 4, where cross-chain interactions are observed). (C) Location of the segments on the (extended) GI.1 VP1 structure. (D) Same table as (B), but for the three crystallographic molecules.

