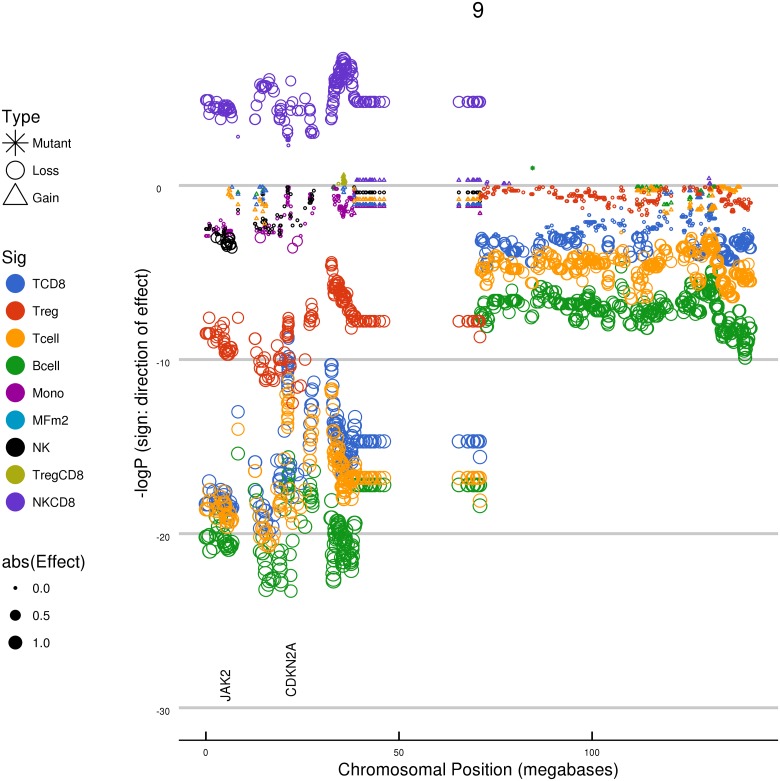
Fig 4. Relationship between chromosome 9 genetic changes and immune cell abundance estimates in TCGA melanoma.
Chromosomal location is displayed on the horizontal axis, and effect size is displayed on the vertical axis. Each data point represents the results for a given locus, with significance (negative log(10) P value) indicated by the size of the data point. The negative log(10) of the multiplicity-corrected model P value is plotted on the vertical axes; negative values indicate a negative effect on the cellular estimate. A large region of chromosome 9p, when lost, is in association with the changes in cellular estimates for many immune cell types. The horizontal axis is the physical coordinate on chromosome 9 in units of 106 bases. The vertical axis is the negative log(10) of the model P value, with negative numbers used to indicate associations that decrease the immune estimate being tested.

