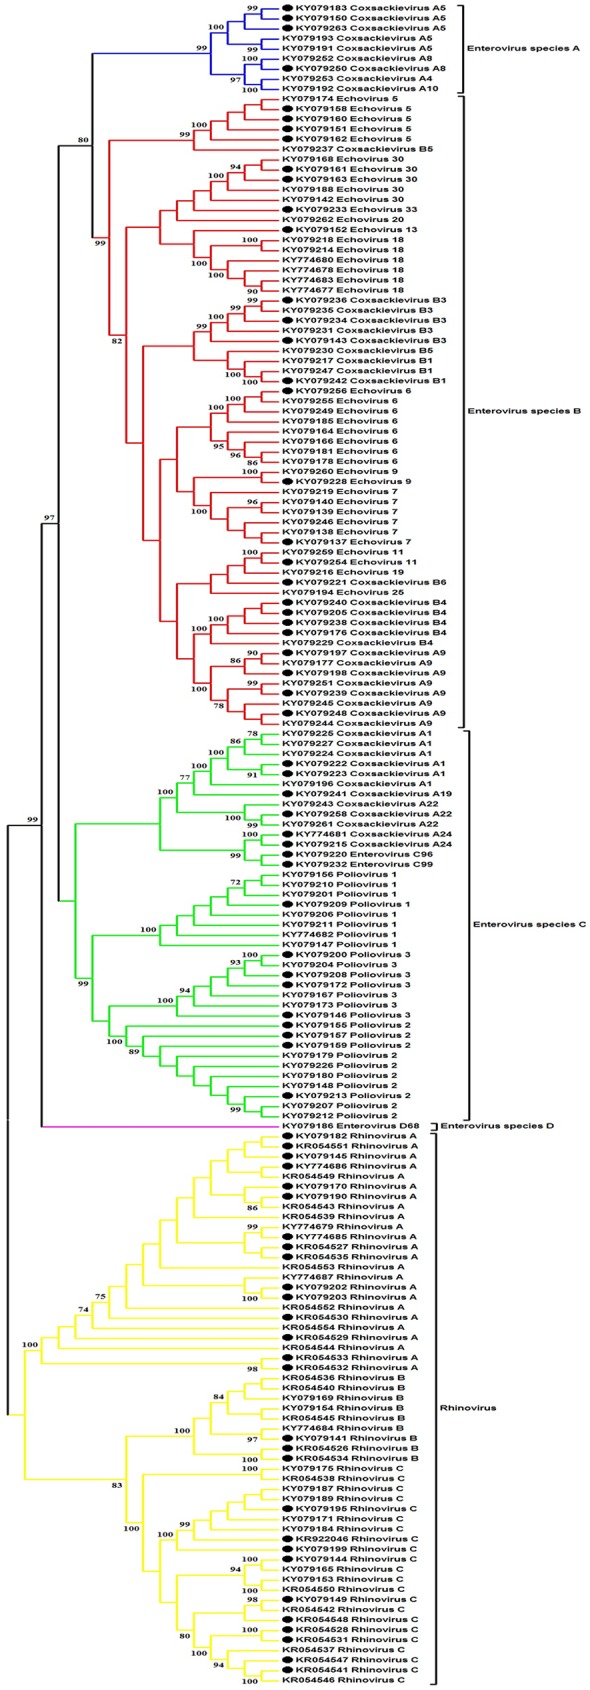
Fig 3. Phylogenetic analysis of the nucleotide sequences of the VP4-VP2 region from EV-positive AGE samples.

Phylogenetic tree was constructed using the neighbor-joining method implemented in MEGA (version 5). Bootstrap resampling values >70 are indicated at the nodes. The scale bar indicates the number of substitutions per site. Black dots denote EV obtained from samples with multiple viruses. Blue, EV-A; red, EV-B; green, EV-C; purple, EV-D; yellow, rhinovirus.
