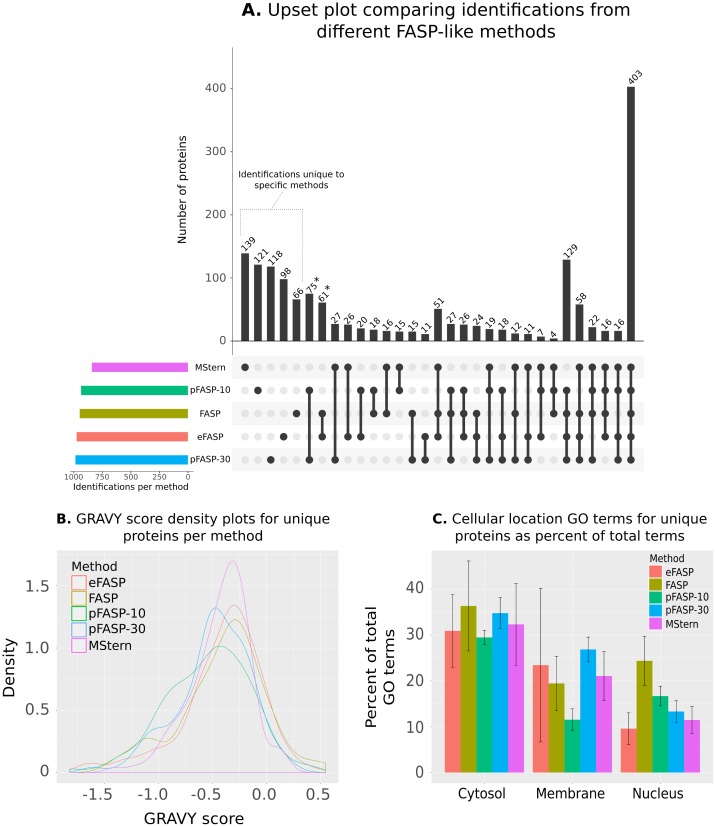
Fig 2. Upset analysis of proteins identified using each sample preparation method and characteristics of unique proteins only identified using a single method.
A. Upset chart showing overlap in proteins identified using each protein processing method. Numbers of identified proteins shared between different sets of methods are indicated in the top bar chart and the specific methods in each set are indicated with solid points below the bar chart. Total identifications for each method are indicated on the left as ‘Identifications per method’. Figure generated using Upset R package [18]; B. Density plots of GRAVY scores for proteins uniquely identified in each protein processing method; and C. Average percent of total ‘cellular component’ GO terms returned by proteins uniquely identified in each replicate of each method that were associated with a cytosolic, membrane or nuclear subcellular location.

