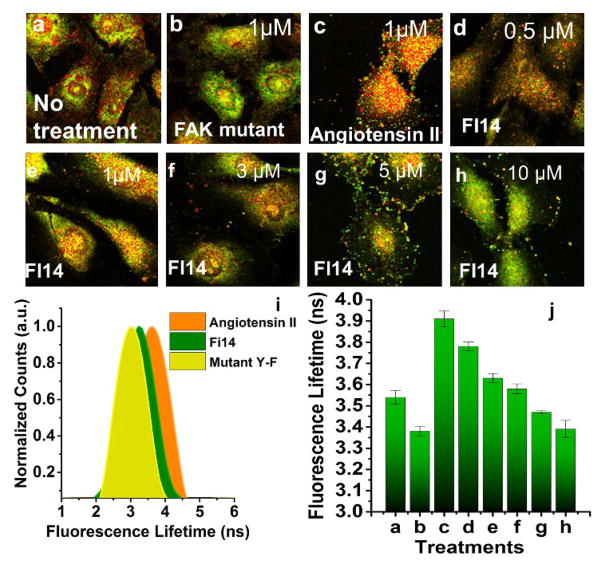
Figure 3.
FAKSOR fluorescence lifetime depends on FAK phosphorylation. (a–h) Fluorescence lifetime images for different treatments; For FAKSOR positive controls, Angiotensin II (1 μM) was added to the medium (c) resulting in a higher average fluorescence lifetime (3.91 ns) compared to control (a,3.54 ns) as well as the negative control mutant FAKSOR (b, 3.38 ns). (d–h) Treatment with FI-14 (90 minutes), a Tyr397 inhibitor, decreased the average fluorescence lifetime of FAKSOR in a dose-dependent manner (d) 0.5 μM (3.78 ns), (e) 1 μM (3.63 ns), (f) 3 μM (3.58 ns), (g) 5 μM (3.47 ns), (h) 10 μM (3.39 ns) (I,j) Quantitative analysis; (i) Fluorophore lifetime per cell calculated based on the average from at least 50 cells in 3 replicates and, for each condition, and plotted as a distribution of observed lifetimes, (j) Quantitative analysis shows average fluorescence lifetime for different treatments (n=50).

