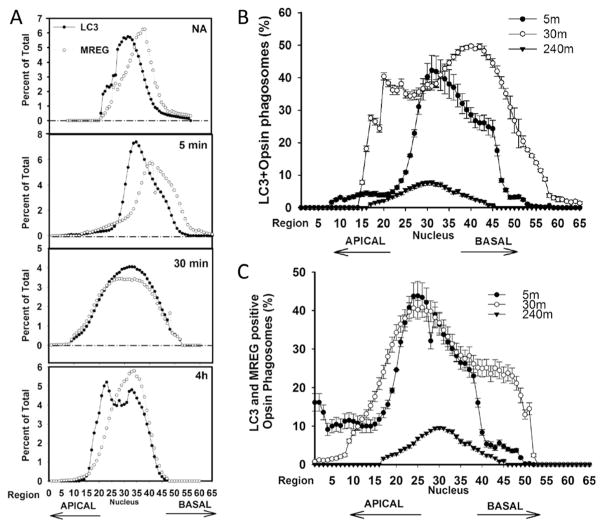
Fig. 6.
MREG and LC3 redistribute within RPE during phagosomes maturation. a Time course of LC3 and MREG distribution in RPE after 20 min OS pulse. The percent of the total intracellular LC3 or MREG is indicated. b LC3-associated phagosomes are more abundant in basal region. LC3–opsin-positive structures were quantified in each Z-slice at various time points indicated. Percent of total POS (opsin-positive structures) that are LC3 positive as a function of position in RPE is indicted. Data are average of three independent experiments each experiment consisted of imaging at least ten regions. Error bars represent ±SEM. c LC3–MREG-associated phagosomes are more abundant in basal region. Percent of total POS (opsin-positive structures) that are LC3 and MREG positive as a function of position in RPE is indicted. Data are average of three independent experiments each experiment consisted of imaging at least ten regions. Error bars represent ±SEM

