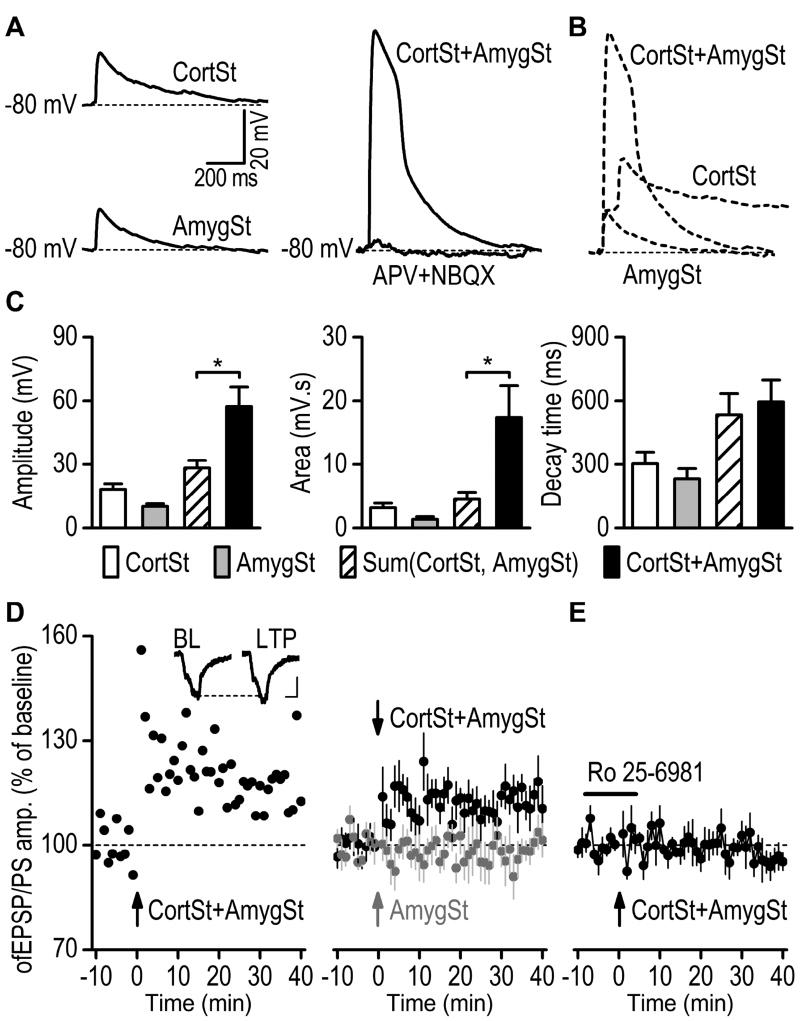
Fig. 6. Pairing of corticostriatal and amygdalostriatal inputs induces LTP in the rat DMS.
(A) Sample traces of optogenetically-induced synaptic responses resulting from the individual activation of CortSt and AmygSt inputs (left) and from co-activation of both inputs (CortSt+AmygSt, right). Whole-cell current-clamp recording was used to measure membrane depolarization. Note that the membrane depolarization induced by co-activation of CortSt and AmygSt inputs were abolished by a cocktail of a NMDAR antagonist (APV, 50 µM) and AMPAR antagonist (NBQX, 10 µM). (B) Dashed traces (data from A) showing that co-activation induced a depolarization with a greater peak amplitude than the sum of the individual peak amplitudes. (C) Bar graphs summarizing the amplitude of (left), the area under (middle), and the decay time (10–90% from the peak amplitude, right) of membrane-potential responses to light stimulation of CortSt, AmygSt, or both inputs. The calculated additive responses [sum(CortSt, AmygSt)] are added for comparison. Note that co-activation induced a membrane-potential response with a greater peak amplitude and area than the sum of the individual responses. *p < 0.05, paired t test. n = 6 neurons from 6 rats. (D) Paired stimulation of the mPFC and BLA afferents at 50 Hz for 2 sec induced significant LTP in the rat DMS. Left, Representative recording showing long-term changes in the fEPSP/PS amplitude following the paired stimulation. The inset depicts the averaged 10-min response of the baseline (BL) and the averaged response 30–40 min after LTP induction (LTP). Scale bars: 5 ms, 50 mV. Right, Averaged responses before and after pairing CortSt and AmygSt stimulation (dark circles) or AmygSt stimulation only (gray circles). n = 8 slices from 4 rats (CortSt + AmygSt) and 6 slices from 3 rats (AmygSt only). (E) Bath application of Ro 25–6981 (5 µM) abolished the LT P induced by pairing CortSt and AmygSt inputs. The horizontal bar indicates the duration of Ro 25–6981 application. n = 5 slices from 5 rats.

