
Figure 1. BioPlex 2.0 Significantly Increases Depth and Breadth of Interactome Coverage.
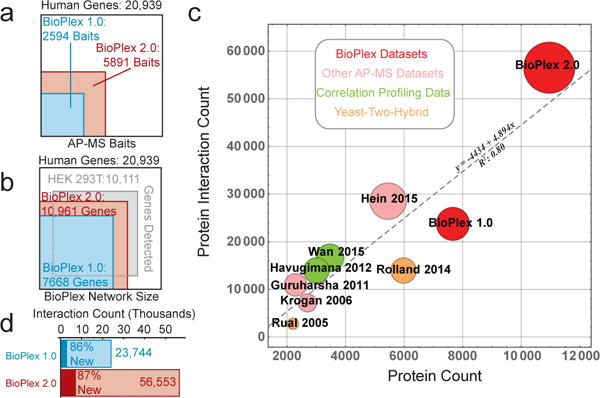
a, bait proteins targeted for AP-MS analysis. b, protein-coding genes included in BioPlex 2.0 as baits or preys. c, The BioPlex 2.0 network significantly exceeds previous experimentally derived interaction networks with respect to protein and interaction counts. Circle area is proportional to interaction counts, while shading denotes the experimental strategy used for interaction mapping. d, BioPlex 2.0 doubles the numbers of interactions revealed in BioPlex 1.0.