
Extended Data Figure 7. BioPlex 2.0 Expands Functional Insights into Uncharacterized Proteins.
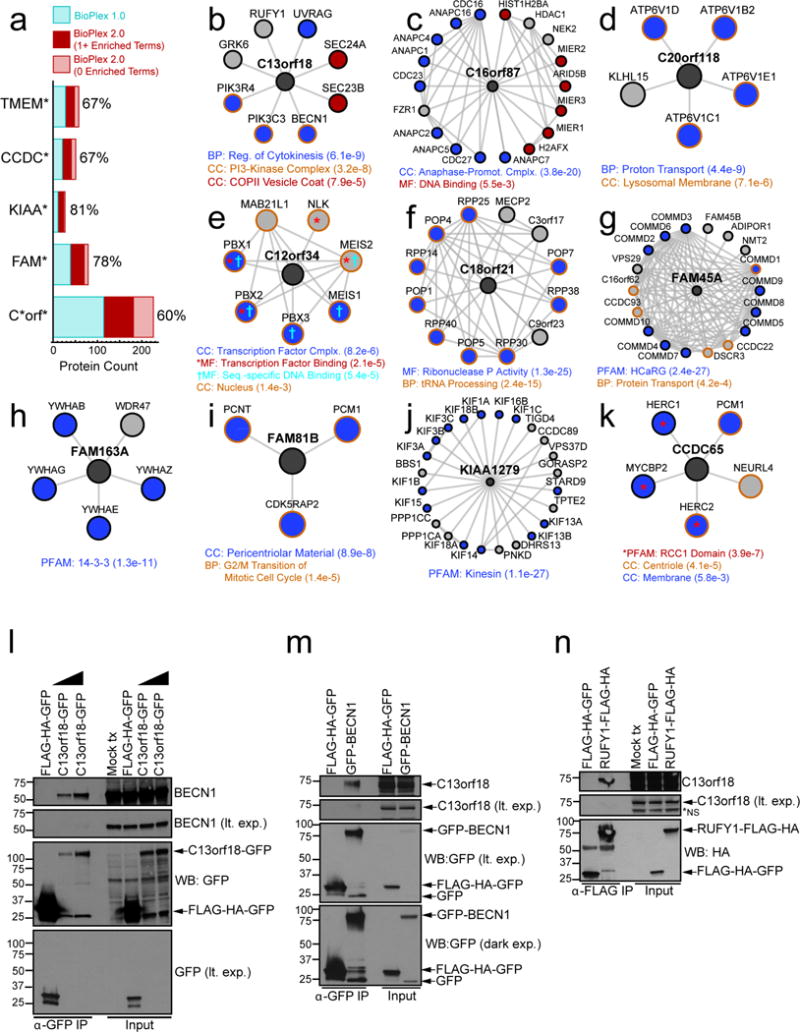
a, stacked bar graph depicting the number of baits targeted in BioPlex 1.0 and BioPlex 2.0 with Gene Symbols matching each pattern; BioPlex 2.0 matches have been subdivided to indicate the fraction that are associated with one or more enriched functional classes (hypergeometric test; Benjamini-Hochberg adjusted p-value < 0.01). This fraction is also expressed as a percentage for each bar. b – k, nearest neighbor sub-networks centered on selected human proteins with limited prior characterization. Color coding is used to highlight proteins that match any enriched functional categories. l–n, Validation of C13orf18 association with components of the BECN1 complex (panel h). Extracts prepared from 293T cells expressing the indicated constructs were subjected to affinity purification using α-GFP resin (l,m) or α-FLAG magnetic beads (n), followed by immunoblotting with α-BECN1 or α-C13orf18 antibodies.