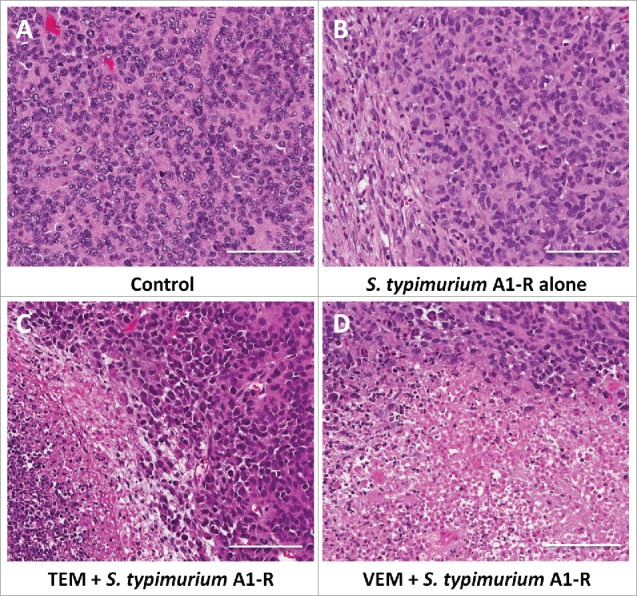
Figure 5.

Histological analysis. Hematoxylin and eosin (H&E) stained slides from tumor tissue of each treatment group. A. Untreated control. B. S. typhimurium A1-R alone. C. S. typhimurium A1-R and TEM. D. S. typhimurium A1-R and VEM. Scale bars: 100 μm.
