Figure 1.

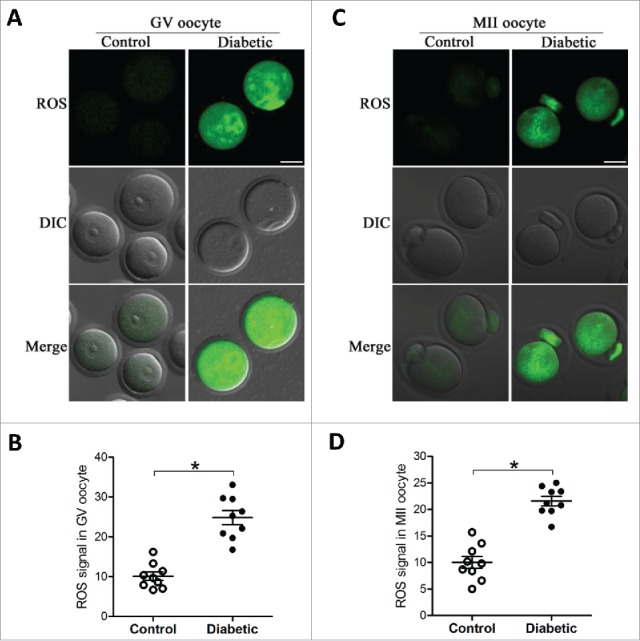
Increased ROS levels in oocyte from diabetes mice. GV and MII oocytes collected from control and diabetic mice were stained by CM-H2DCFAD (green) to evaluate ROS levels. (A and C) Representative images of CM-H2DCFAD fluorescence in oocytes from control and diabetic mice. Scale bar: 25 μm. (B and D) Quantitative analysis of fluorescence intensity shown in A and C (n = 9 oocytes for each group). Data were expressed as mean ± SD from 3 independent experiments. *p < 0.05 vs control.
