
Figure 2.
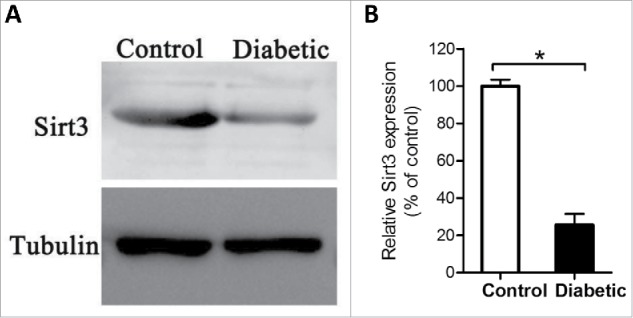
Reduced Sirt3 expression in oocyte from diabetes mice. Fully-grown GV oocytes were collected from control and diabetic mice, and then processed for immunoblotting. (A) Western blot analysis showed the reduced Sirt3 expression in oocytes from diabetic mice compared with controls. Tubulin served as an internal control. (B) Band intensity was measured by Image J software, and the ratio of Sirt3/Tubulin expression was normalized. All protein gel blot experiments were repeated at least 3 times, with a representative gel image shown.