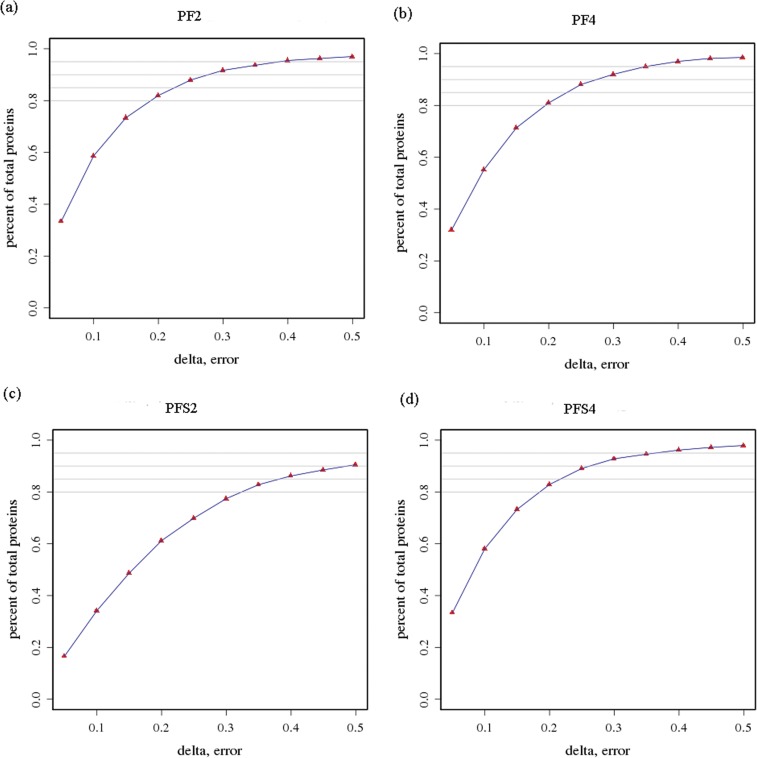
Fig 2. Repeatability of the expression of duplicate samples.
(a) PF2; (b) PF4; (c) PFS2; (d) PFS4. X-axis represents the difference of the quantitative ratios between the first and the second biological repeats of the two samples. The right y-axis represents the cumulative percentage between the proteins of a certain range and the quantitative proteins, while the left y-axis represents the number of total protein in a certain range.

