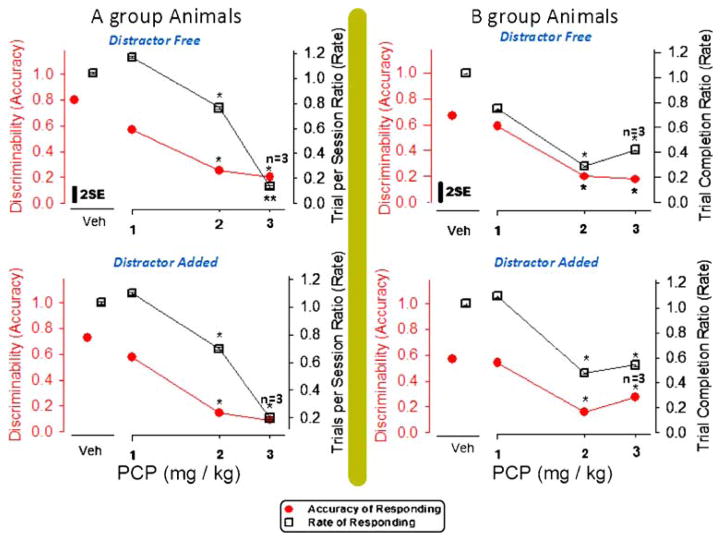
Fig. 2.
Effects of PCP in A-group rats (right panels) and in B-group rats (left panels) on the discriminability (d′) value measured in distracter-free components (upper panels) and counter measured in distracter-added components (lower panels) of an RD schedule. Variance in each panel is indicated by a bar representing 2×(√mean square error from GLM ÷ √N). *Significant difference from the vehicle value assessed by the Duncan method

