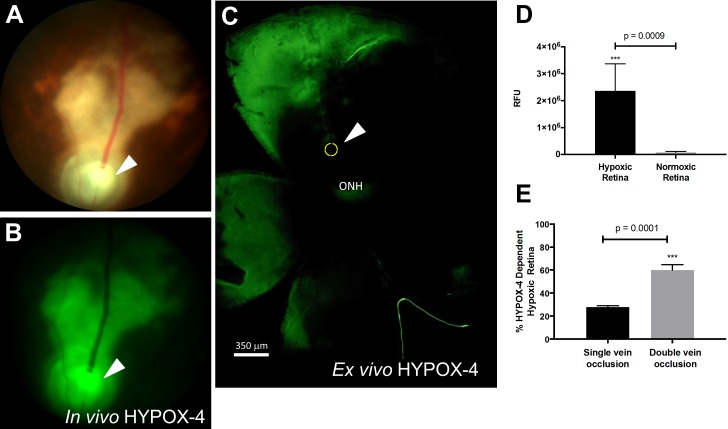
Figure 5.
HYPOX-4–dependent in vivo and ex vivo imaging of retinal hypoxia in a RVO mouse. HYPOX-4 was administered by intraperitoneal injection 2 hours post-PRVT. In vivo imaging was performed 22 hours post injection. (A) Bright-field fundus photograph of a RVO mouse. The arrowhead and yellow circle show the position of the vein occlusion. (B) In vivo HYPOX-4–dependent fluorescence activity was detected upstream from the occlusion, indicating retinal hypoxia (green). (C) Ex vivo HYPOX-4–dependent fluorescence activity detected in the same retina (green). (D) Relative fluorescence intensity was measured using ImageJ software from hypoxic and normoxic retina in (B) and represented as RFU. (E) Quantitative analysis of HYPOX-4–dependent fluorescence in RVO retinas receiving single or double vein occlusion. Student's t-test was performed and P < 0.001 is considered as highly significant. ONH, optic nerve head.

