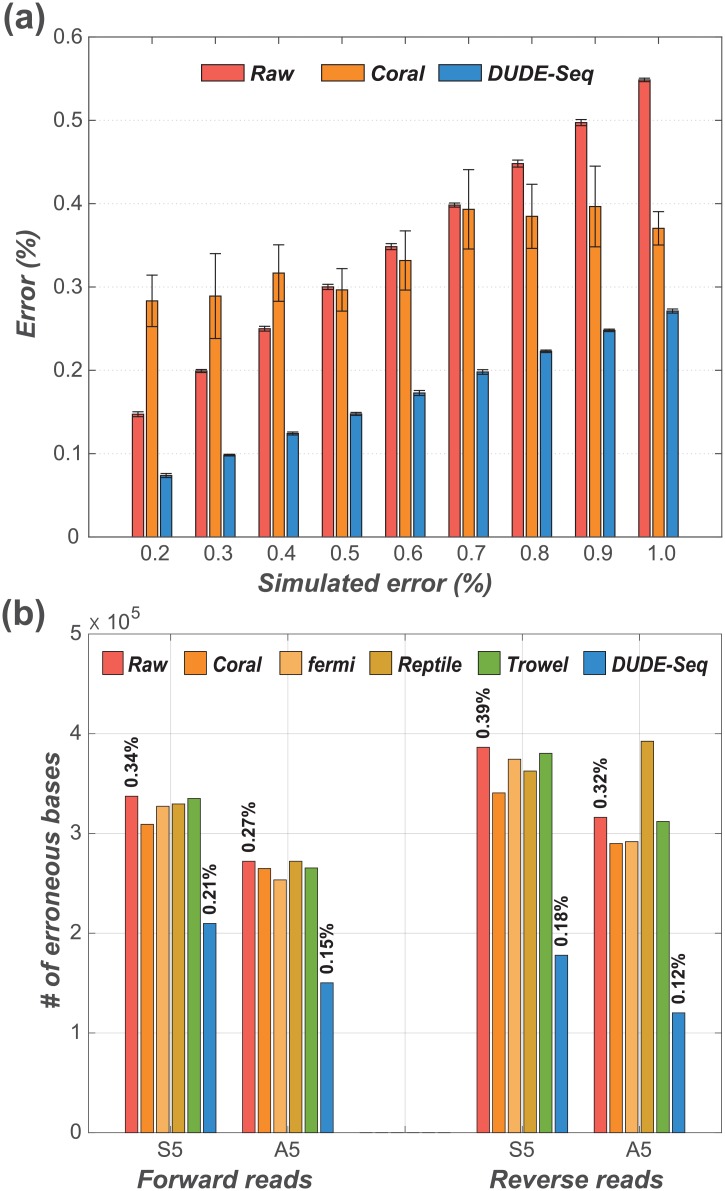
Fig 9. Reads correction performance on simulated dataset.
[parameters: k = 5 for DUDE-Seq; k = 10 for Trowel; (k, mr, mm, g) = (21, 1, 1, 1000) for Coral; optimal values set by tool seq-analy for Reptile; (k, O, C, s) = (21, 3, 0.3, 5) for fermi]: (a) Varying error rates using the Grinder simulator [50]. (b) Varying reads composition using the GemSIM simulator [51] (values on top of each bar represent the error rates).

