Figure 1. AOB MCs express robust, slowly emerging self-inhibition.
(A) Schematic of dendrodendritic self-inhibition pathway in MCs. (B) Left, dye-filled MC imaged after recording. S, soma; d, dendritic tufts that integrate sensory inputs; p, recording pipette. Right, brief, high-frequency spike trains trigger modest self-inhibition (gray, standard ACSF; black, after blocking inhibition with 15 µM BMI; IPSP, inhibitory postsynaptic potential). (C) Pharmacologically isolated self-inhibition in AOB MCs. Colored traces show individual cells; black trace, average; mean Vinh = −1.4 ± 0.27 mV (n = 8 cells in 5 mice). (D,E) Prolonged firing elicits robust MC self-inhibition in AOB but not MOB (black and purple respectively). Boxes show expanded view of barrages of IPSPs in AOB MCs, indicated by arrowheads, which only emerge after several seconds of firing. (F) Self-inhibition contributes to stronger decay of MC firing rates in AOB during extended stimuli (n = 9 and 9 cells in 5 and 5 mice for AOB and MOB respectively). (G) Initial and final firing rates during MC spike trains in MOB and AOB (purple and gray respectively).
DOI: http://dx.doi.org/10.7554/eLife.25421.003

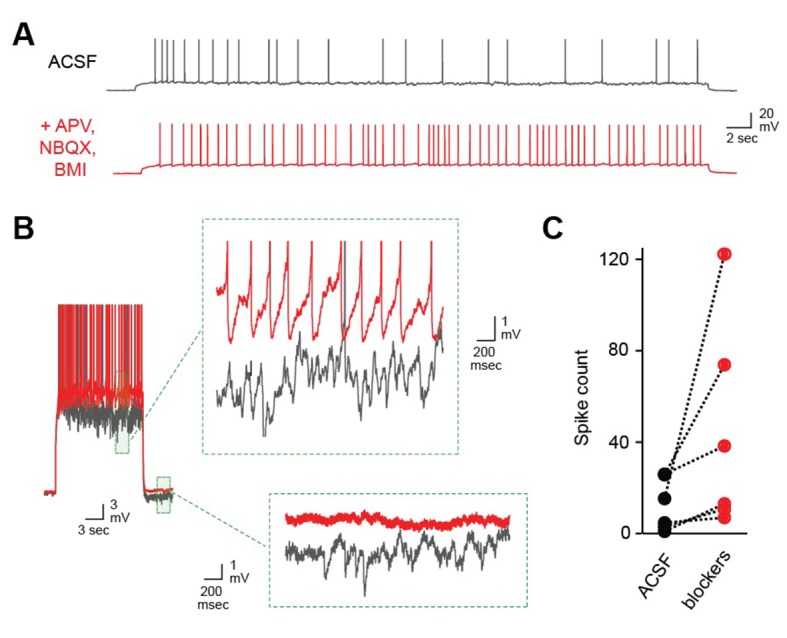
Figure 1—figure supplement 1. Robust self-inhibition regulates spiking of AOB MCs.