. 2017 Jun 16;6:e25421. doi: 10.7554/eLife.25421

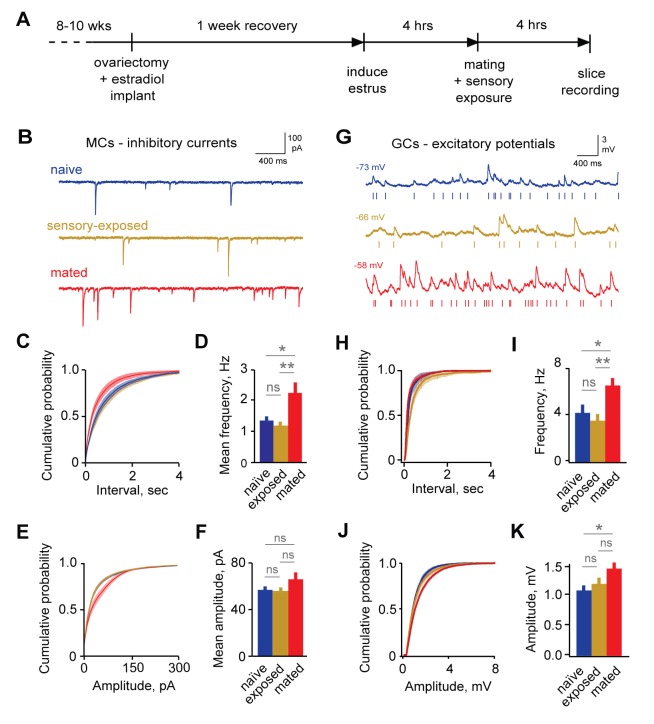
Figure 2. Imprinting drives synaptic plasticity in both MCs and GCs.

(A) Schematic of timeline for mating, sensory experience, and recording. (B) Inhibitory synaptic inputs recorded in voltage-clamped MCs from naïve, sensory-exposed, and mated mice. (C,D) Mating substantially increases mIPSC frequency. Left, cumulative interval distributions; mated < naïve and exposed groups, p=0.002 and 0.001 respectively. Right, mean frequency (F = 5.88; Fc = 3.20; p=0.005 for mated vs. naïve; ANOVA with post-hoc Tukey test; n = 18, 17, and 15 cells in 5, 5, and 6 mice respectively). (E,F) The mean amplitude of mIPSCs was not significantly changed by imprinting (F = 1.74; Fc = 3.20; p=0.19; ANOVA with post-hoc Tukey test), although distributions were significantly shifted towards smaller values in the mated vs. naïve and sensory-exposed groups (p=0.00007 and 3 × 10⁻⁷ respectively. (G) Example traces showing spontaneous EPSPs in GCs from naïve, sensory-exposed and mated mice. Rasters indicate synaptic events used for analysis. (H,I) Mating increased mean sEPSP frequency relative to both naïve and sensory-exposed animals (F = 6.64; Fc = 3.14; p=0.00037 and 0.038 for mated vs. exposed and naïve mice respectively; ANOVA with post hoc Tukey test; n = 17, 19, and 30 cells in 5, 9, and 12 mice). Interval distributions were significantly smaller for mated vs. exposed and naïve animals (p=1×10⁻¹¹ and 0.0008 respectively). (J,K) Mating also increased mean sEPSP amplitude in mated vs. naïve animals. Left, cumulative distribution; right, mean amplitude (F = 3.56; Fc = 3.14; p=0.037 for naïve vs. mated, ANOVA with post hoc Tukey test). Amplitude distributions were larger for mated vs. naïve mice (p=0.04). NS, not significant; *p<0.05; **p<0.001.

DOI: http://dx.doi.org/10.7554/eLife.25421.006

Figure 2—source data 1. This spreadsheet contains the mean frequency and amplitude data for the individual neurons used to generate the bar plots shown in Figure 2D and F (mitral cell mIPSCs) and 2I and 2K (granule cell mEPSCs).
These data can be opened with Microsoft Excel or with open-source alternatives such as OpenOffice.
DOI: 10.7554/eLife.25421.007

Figure 2.

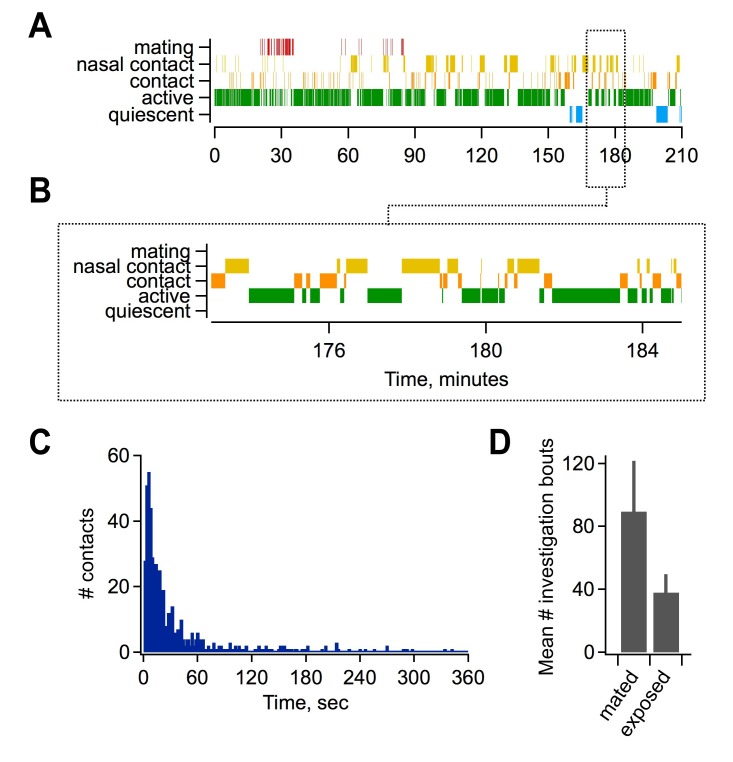
Figure 2—figure supplement 1. Mating and sensory interactions during pairing.

Figure 2—figure supplement 1.

(A) Video analysis of characteristic post-mating behavior between females and males. Top, mating typically occurred early during the pairing period (red), followed by extensive and repetitive behavioral encounters including direct nasal contact required for vomeronasal activation (yellow). Bottom, expanded view of approximately 10 min of female-male interactions. (B) Distribution of intervals between investigatory bouts in the mated group (mean, 62.1 ± 7.99 s; median, 15.9 s; n = 554 bouts in 7 animals). (C) Investigatory behavior is elevated in mated relative to sensory-exposed groups (mean bouts per female, 89.5 ± 32.1 vs. 38 ± 11.6 respectively; n = 7 animals per group).
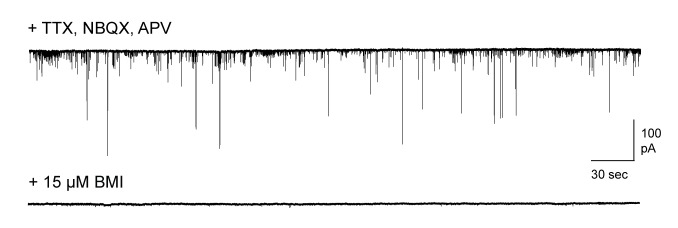
Figure 2—figure supplement 2. Pharmacologically isolated inhibitory synaptic currents in MCs.

Figure 2—figure supplement 2.

Top, inward currents recorded from voltage-clamped MCs using high-chloride pipette solution, measured in the presence of TTX, NBQX, and APV. Bottom, miniature currents were completely blocked by addition of 15 µM bicuculline.
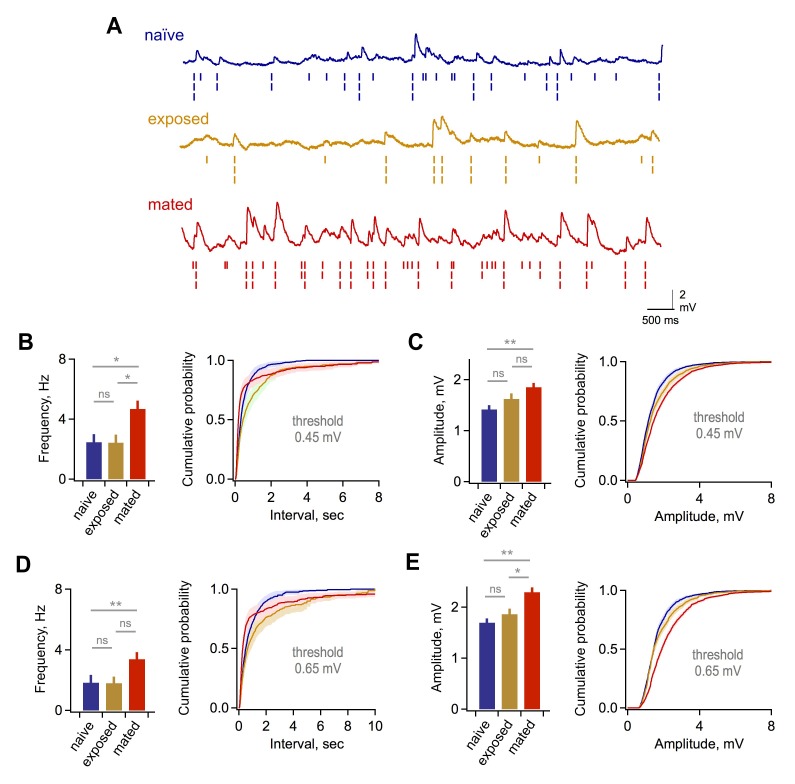
Figure 2—figure supplement 3. Synaptic effects in GCs are independent of event detection criteria.

Figure 2—figure supplement 3.

(A) Raw data traces with rasters showing synaptic events detected using thresholds of 0.25, 0.45, and 0.65 mV. (B) Mean frequency (left) and cumulative distribution of interevent interval (right) for excitatory synaptic input using a detection threshold of 0.45 mV. Mean frequency, 2.47 ± 0.53, 2.43 ± 0.53, and 4.69 ± 0.55 Hz; F = 5.93; Fc = 3.14; p=0.012 and 0.038 for mated vs exposed and naïve groups respectively. (C) Mean and cumulative distribution of EPSP amplitudes for the same criteria. Mean amplitudes, 1.42 ± 0.08, 1.62 ± 0.11, and 1.85 ± 0.08 mV for naïve, exposed, and mated groups respectively. F = 5.58; Fc = 3.14; p=0.0047 for mated vs. naïve groups. (D,E) Corresponding plots using a threshold of 0.65 mV. Mean frequency, 1.84 ± 0.51, 1.80 ± 0.42, and 3.38 ± 0.46 Hz; F = 3.89; Fc = 3.14; p=0.048 for mated vs naïve groups. Mean amplitude, 1.70 ± 0.08, 1.86 ± 0.11, and 2.29 ± 0.09 mV for naïve, exposed, and mated groups respectively. F = 10.52; Fc = 3.14; p=0.0021 and 0.0062 for mated vs. naïve and exposed groups respectively. *p<0.05; **p<0.005; all p values calculated using ANOVA with post-hoc Tukey test.