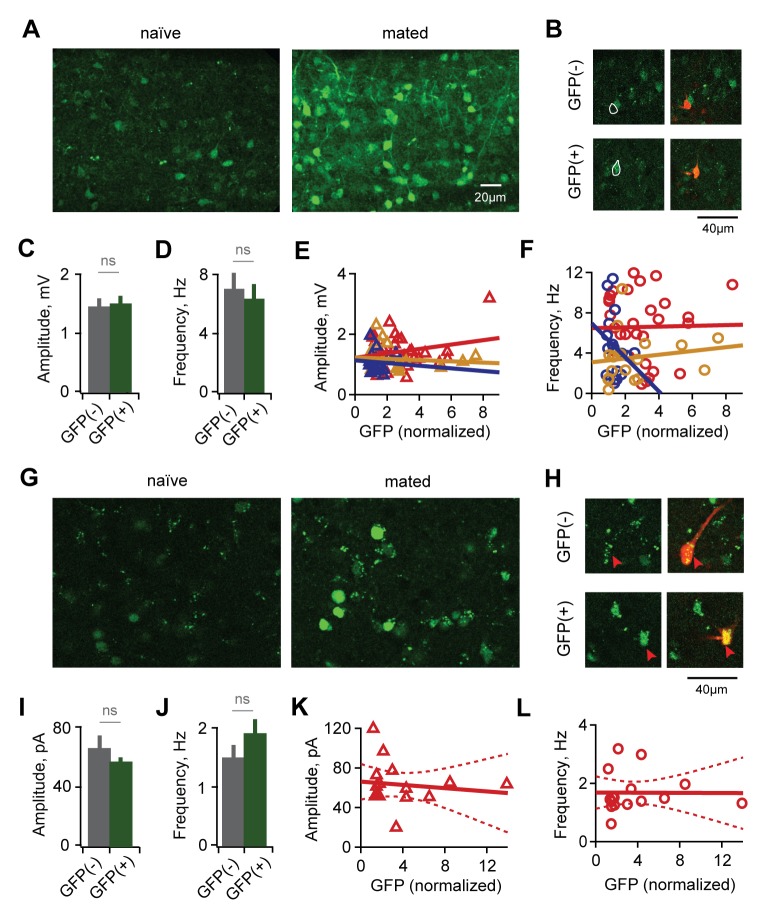
Figure 3. Synaptic plasticity is uncorrelated with activation during mating.
(A) Arc-GFP labeling of AOB GCs activated by the stud male, visualized with live-tissue 2-photon imaging. Left, naïve control animal; right, mated female. (B) Fluorescence-targeted recordings of both unlabeled and labeled populations of GCs. (C,D) Mean amplitude and frequency of sEPSPs are similar for GFP(-) and GFP(+) GCs in mated mice (amplitude: p=0.82; frequency, p=0.58; t-test; n = 9 and 13 cells in 10 mice, GFP(+) and (-) groups subdivided from data in Figure 3—figure supplement 1). (E,F) GFP labeling is uncorrelated with either amplitude or frequency of spontaneous excitatory input to GCs (regression slope not different from zero; amplitude: p=0.70 and 0.22 for sensory-exposed and mated groups respectively; frequency: p=0.50 and 0.92; linear regression t-test; n = 17, 19 and 30 neurons in 5, 9, and 12 mice for naïve, exposure and mated groups). (G) Fos-GFP labeling reveals a subpopulation of mating-activated MCs (arrowheads). (H) Targeted recordings of stud-activated MCs. (I,J) Mean amplitude and frequency of mIPSCs are not significantly different between GFP(-) and GFP(+) MC populations (p=0.33 and 0.38 respectively; t-test; n = 8 and 5 cells in 5 mice; groups subdivided from data in Figure 2). (K,L) Amplitude and frequency of mIPSCs show no correlation with Fos-GFP intensity in MCs (regression slope not different from zero; p=0.64 and 0.97 respectively; linear regression t-test; n = 16 neurons from 5 mice). Dashed lines show 95% confidence intervals.
DOI: http://dx.doi.org/10.7554/eLife.25421.011


