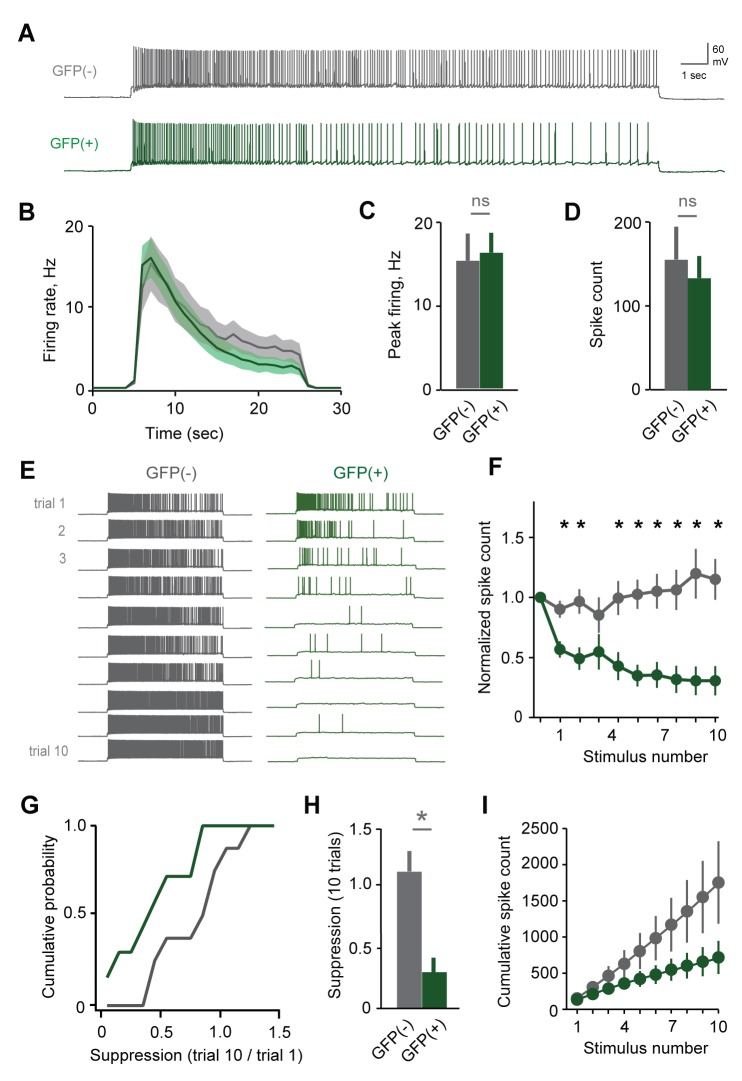
Figure 6. Plasticity in MC responsiveness is specific to mating-activated neurons.
(A) Both GFP(-) and GFP(+) MCs show similar initial responses to current stimuli. (B) Mean firing rate profiles for GFP(+) and GFP(-) MCs in Fos-GFP females after mating (mean ± SEM; n = 7 and 11 cells in 5 and 7 mice). (C, D) Initial MC output is similar between GFP(-) and GFP(+) groups (firing rate, p=0.81; spike count, p=0.63; t-test). (E) Representative MC responses to repetitive stimulation in mated females. (F) After mating, GFP(-) MCs maintain consistent firing, but the output of stud-activated GFP(+) neurons is dramatically attenuated over time (mean ± SEM; n = 7 and 11 cells in 7 mice). (G) Cumulative histograms indicate a shift towards greater suppression in the MCs activated during mating (p=0.18; Kolmogorov-Smirnov test). (H) Mean suppression after 10 trials for GFP(-) and GFP(+) neurons (spike count on 10th vs. 1st trial: unlabeled, 115 ± 17%, p=0.41; labeled, 30.7 ± 12.3%; p=0.0017; t-test). (I) Cumulative action potential output of GFP(-) and GFP(+) MCs, averaged across all recorded neurons.
DOI: http://dx.doi.org/10.7554/eLife.25421.018


