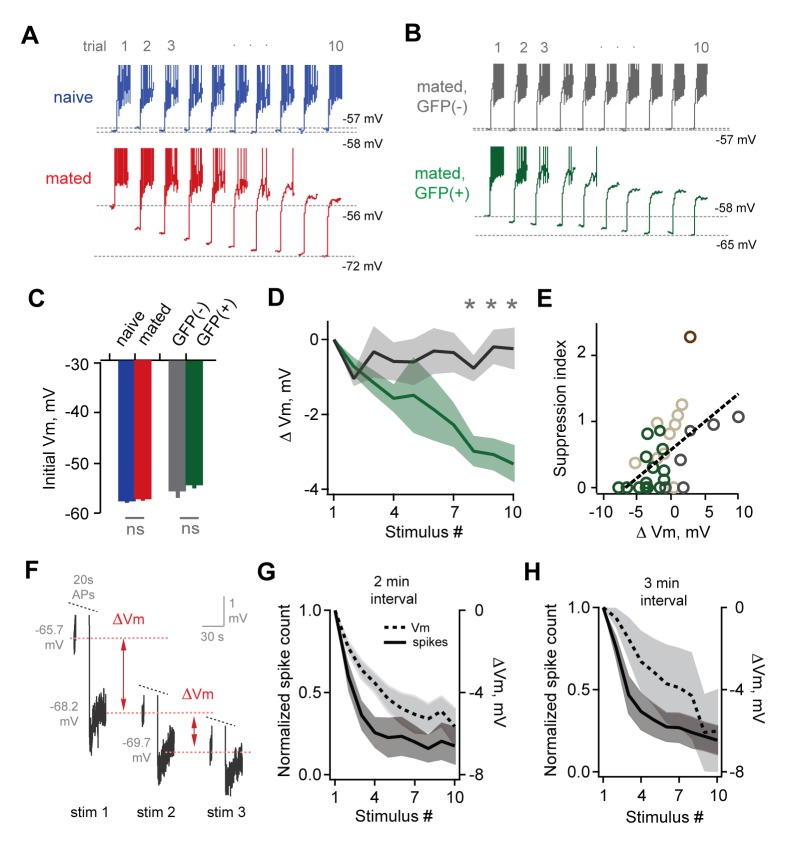
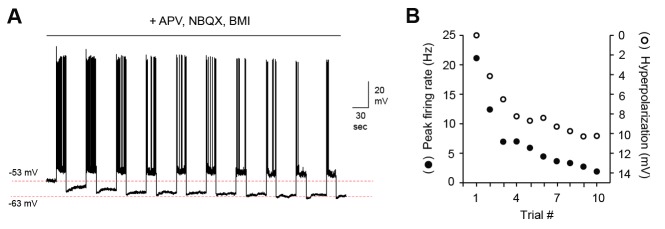
Figure 7. Loss of MC sensitivity results from progressive membrane potential hyperpolarization.
(A) Representative MC responses to repetitive stimulation, showing initial resting potential and onset of firing for each trial. Progressive hyperpolarization was greatly enhanced in mated vs. naïve mice (red and blue respectively). (B) Within the AOB of mated females, hyperpolarization was selectively expressed in mating-activated GFP(+) MC populations. (C) Initial resting membrane potential was similar for MCs from naïve vs. mated females (blue and red respectively; p=0.76; n = 9 and 15 cells in 5 and 7 mice), and for labeled and unlabeled MC populations in mated animals (gray and green; p=0.56; t-test; n = 7 and 11 neurons in 5 and 7 mice). (D) Mean hyperpolarization during repetitive stimulation for GFP(+) and GFP(-) MCs (green and gray; upper and lower 1/3 of the recorded population; *, p<0.05; t-test). (E) Progressive loss of MC responsiveness is correlated with membrane hyperpolarization. Green, GFP(+); dark gray, GFP(-); light gray, intermediate. (F) Membrane hyperpolarization persists for > 2.5 min between stimuli. Traces show Vm before and after three successive spike trains delivered 3 min apart. Red dashes show step-like hyperpolarization lasting until the next stimulus. (G,H) Mean hyperpolarization and normalized change in firing for MCs tested with stimuli 2 min and 3 min apart.
DOI: http://dx.doi.org/10.7554/eLife.25421.022


