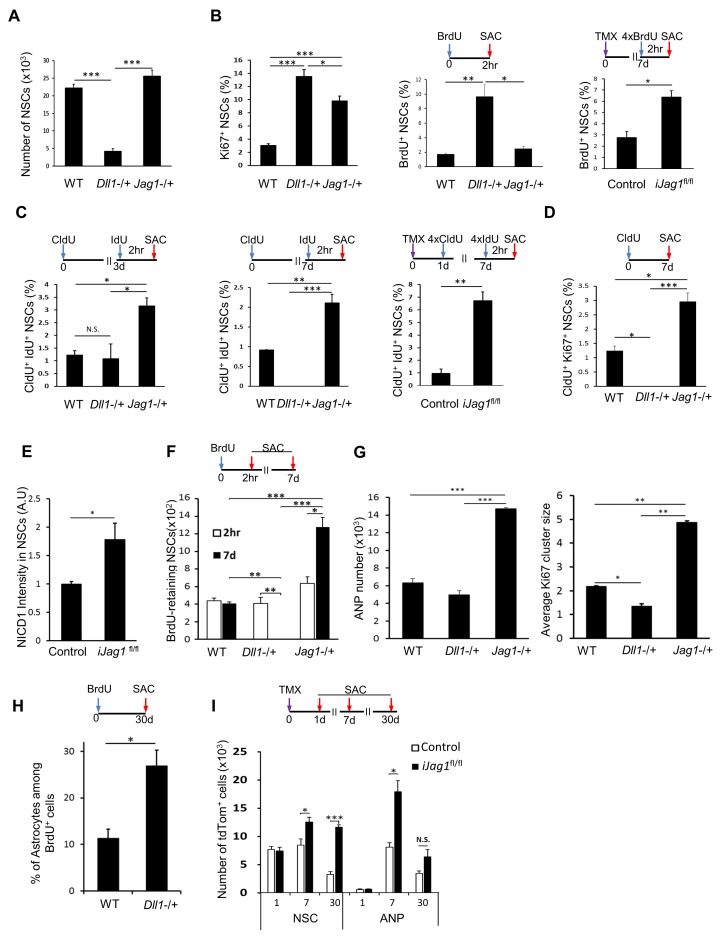
Figure 6. Notch ligands Jag1 and Dll1 regulate NSC cell cycle.
(A) The number of NSCs is diminished in mice lacking Dll1 compared to both wild-type and mice lacking Jag1 (N = 4 per group; One-way ANOVA p<0.00001, Tukey HSD post-hoc test p<0.0001 for Dll1 vs wild-type or Jag1−/+, p=0.1663 for wild-type vs Jag1−/+). (B) Lack of either Dll1 or Jag1 promotes increased division of NSCs. Left panel: Absence of Dll1 or Jag1 is associated with significantly higher proportion of cycling, Ki67+ NSCs (N = 4 per group, One-way ANOVA p<0.00001, Tukey HSD post-hoc test p<0.0001 for wild-type vs Dll1−/+ or Jag1−/+, p=0.046 for Dll1−/+ vs Jag1−/+). Middle panel: Mice lacking Dll1 have significantly higher proportion of dividing, BrdU+ NSCs compared to both wild-type and Jag1−/+ mice (N = 4 per group; One-way ANOVA p<0.0005, Tukey HSD post-hoc test p=0.0007 for wild-type vs Dll1−/+, p=0.0015 for Jag1−/+ vs Dll1−/+, p=0.8393 for wild-type vs Jag1−/+). Right panel: Absence of both copies of Jag1 in iJag1fl/fl mice is associated with significantly higher proportion of actively dividing, BrdU+ NSCs compared to controls (N = 4 per group; Student’s t-test, p=0.0028). (C) Lack of Dll1 has an opposite effect on NSC S-phase re-entry compared to lack of Jag1. Relative number of NSCs that re-enter S-phase 3 (left panel) and 7 (middle panel) days following the initial division is significantly lower in mice lacking Dll1 at 7 days, while it is significantly higher at both timepoints in mice lacking Jag1 compared to wild-type mice (for 3d: N = 4 per group; One-way ANOVA p=0.0074, Tukey HSD post-hoc test p=0.9624 for wild-type vs Dll1−/+, p=0.011 for Jag1−/+ vs Dll1−/+, p=0.0164 for wild-type vs Jag1−/+; for 7d: N = 4 per group; One-way ANOVA p<0.0001, Tukey HSD post-hoc test p=0.0016 for wild-type vs Dll1−/+, p<0.0001 for Jag1−/+ vs Dll1−/+, p=0.0002 for wild-type vs Jag1−/+). CldU+ IdU+ cells represent NSCs that underwent first division at the time of CldU injection (day 0) and were in S-phase at the time of IdU injection (day 3 or day 7). Right panel: In iJag1fl/fl mice, significantly higher proportion of NSCs re-enter S-phase 6 days following the initial division compared to controls (N = 4 per group; Student’s t-test, p=0.0003). CldU+ IdU+ cells represent NSCs that were induced at day 0, underwent first division at 1 day post-induction (CldU+) and were in S-phase (IdU+) at 7 days post-induction. (D) Lack of Dll1 has an opposite effect on NSC cycling time compared to lack of Jag1 (N = 4 per group; One-way ANOVA p<0.00001, Tukey HSD post-hoc test p=0.0049 for wild-type vs Dll1−/+, p=0.005 for wild-type vs Jag1−/+ and p<0.0001 for Dll1−/+ vs Jag1−/+). CldU+ Ki67+ NSCs represent NSCs that are cycling 7 days following the CldU injection. (E) Lack of Jag1 increases Notch signal intensity in NSCs. Relative intensities of NICD1 staining are significantly higher in Jag1 mutant NSC clones compared to control NSCs (N = 3 for iJag1fl/fl, N = 4 for control; Student’s t-test p<0.0255). (F) In Dll1−/+ mice, no NSCs that retained BrdU 7 days after the BrdU injection were detected. In Jag1−/+ mice, the absolute number of BrdU-retaining NSCs is significantly higher at both timepoints compared to wild-type mice, suggesting increased self-renewal of NSCs lacking Jag1 (For 7d: N = 4 per group; One-way ANOVA p<0.00001, Tukey HSD post-hoc test p<0.0001 for wild-type vs Jag1−/+ and Jag1−/+ vs Dll1−/+, and p=0.0035 for wild-type vs Dll1−/+. For 2hr-7d comparisons: p=0.0028 for Jag1−/+ and p=0.001 for Dll1−/+ mice). (G) Left graph: Mice lacking Jag1 have significantly more Sox2+ ANPs compared to both wild-type and mice lacking Dll1 (N = 4; One-way ANOVA p<0.00001; p<0.00001 for wild-type vs Jag1−/+ and Dll1−/+ vs Jag1−/+; p=0.2828 for wild-type vs Dll1−/+). Right graph: Average size of Ki67+ clusters around Ki67+ NSCs is larger in Jag1−/+ mice compared to wild-type and Dll1−/+ mice (N = 4; One-way ANOVA p<0.00001; p=0.0001 for wild-type vs Jag1−/+; p=0.0015 for wild-type vs Dll1−/+, p<0.0001 for Dll1−/+ vs Jag1−/+). (H) One month following BrdU injection, Dll1−/+ mice have significantly higher ratio of S100β+ progeny among newly generated cells compared to wild-type (N = 4; Student’s t-test, p=0.016). (I) In iJag1fl/fl mice, significantly more tdTomato+ NSCs accumulate at 7 and 30 days post-induction compared to controls, suggesting increased self-renewal in Jag1 mutant NSCs. This is accompanied by increased number of tdTomato+ ANPs (N = 4 per group; p=0.0263 and p<0.0001 for NSCs at 7d and 30d, respectively; p=0.0033 and p=0.069 for ANPs at 7d and 30d, respectively). Please note that all wild-type and control mice presented here are same as in Figure 5, as the experiments using the knockout lines (Lfng−/+, Dll1−/+, Jag1−/+, iLfngfl/fl, iJag1fl/fl) were done at the same time. The results are presented in two figures for clarity. Bars represent mean ± SEM* p<0.05, **p<0.001, ***p<0.0001. See Figure 6—figure supplement 1 for further details.


