. 2017 Jul 10;6:e26801. doi: 10.7554/eLife.26801

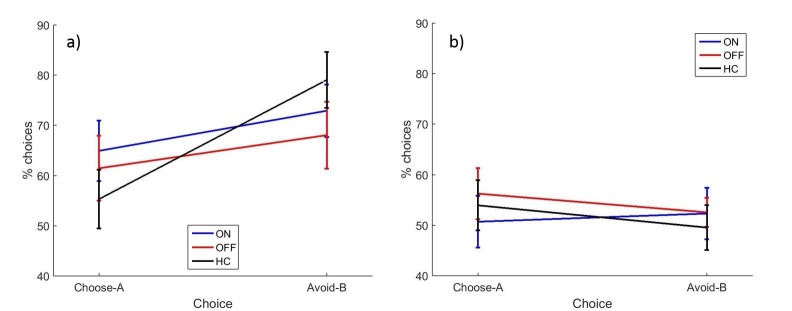
Figure 4. The mean percentages of selections on the novel pairs test for a) experiment 2 and b) experiment 3.

There were no significant effects of disease state or medication condition on either selection in either experiment 2 (p>0.2) or experiment 3 (p>0.3). Error bars are SEM. Figure 4—figure supplement 1 shows the data after filtering was applied to experiment 2, and Figure 4—figure supplement 2 shows the filtered data for experiment 3. Figure 4—source data 1 shows the summary statistics.

DOI: http://dx.doi.org/10.7554/eLife.26801.012

Figure 4—source data 1. Summary statistics for Figure 4, the percentages of choose-A and avoid-B selections in experiments 2 and 3 novel pairs tests.
DOI: 10.7554/eLife.26801.013

Figure 4.

Figure 4—figure supplement 1. The mean percentage of selections for the filtered data for experiment 2.
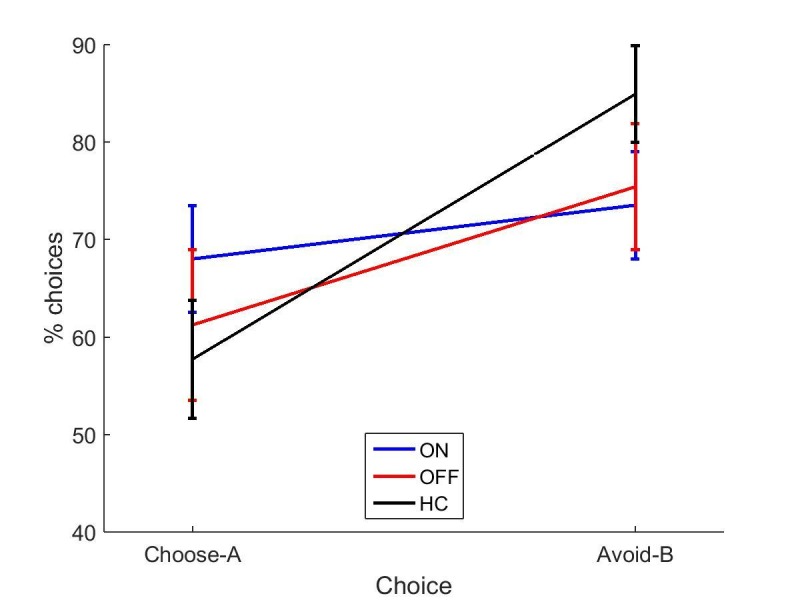
Figure 4—figure supplement 1.

Independent-samples t-tests showed no significant effects on choose-A or avoid-B for disease state (df = 47, p=0.361, d = 0.2768; p=0.126, d = 0.4681) or medication state (df = 30, p=0.473, d = 0.2575; p=0.825, d = 0.0792). Error bars are SEM.
Figure 4—figure supplement 1—source data 1. Summary statistics for Figure 4—figure supplement 1, percentages of choose-A and avoid-B behaviours for experiment 3, after data filtering.
DOI: 10.7554/eLife.26801.015
Figure 4—figure supplement 2. The mean percentage of selections for the filtered data for experiment 3.
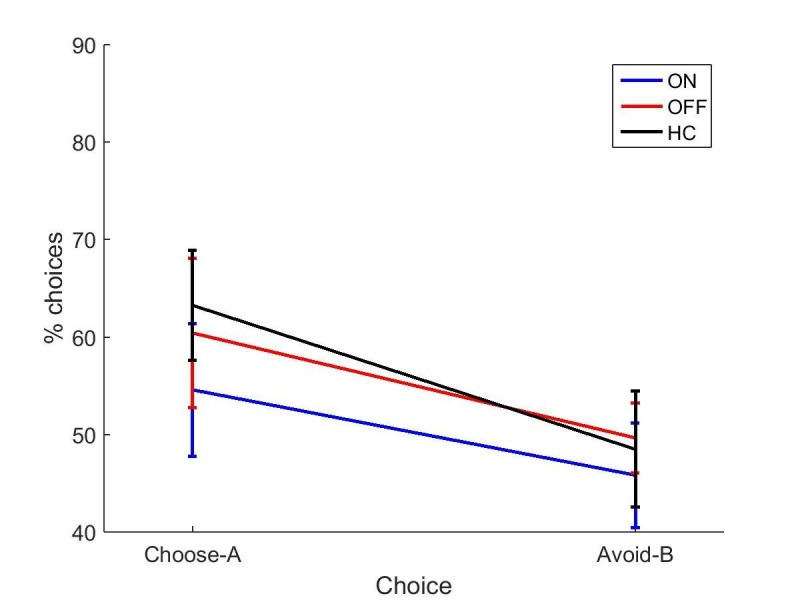
Figure 4—figure supplement 2.

Independent-samples t-tests showed no effects of disease state (df = 31, p=0.509, d = 0.2465; p=0.926, d = 0.0345) or medication state (df = 20, p=0.579, d = 0.2415; p=0.555, d = 0.25658). Error bars are SEM.
Figure 4—figure supplement 2—source data 1. Summary statistics for Figure 4—figure supplement 2, percentages of choose-A and avoid-B behaviours for experiment 2, after data filtering.
DOI: 10.7554/eLife.26801.017