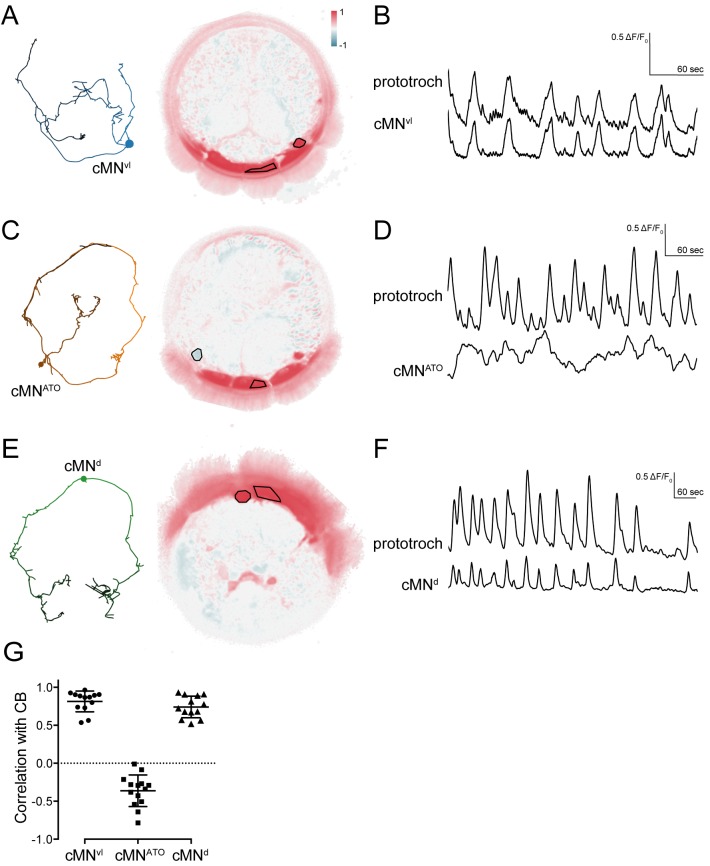
Figure 6. Activity of cMN neurons.
(A) ssTEM reconstruction (left) and correlation (Pearson's r) map of neuronal activity (right) of cMNvl, anterior view. Correlation values were calculated relative to the prototroch (outlined). (B) Calcium-imaging trace of cMNvl and the prototroch (C) ssTEM reconstruction (left) and correlation (Pearson’s r) map of neuronal activity (right) of cMNATO. Correlation values were calculated relative to the prototroch (outlined). (D) Calcium imaging trace of cMNATO and the prototroch. (E) ssTEM reconstruction (left) and correlation (Pearson’s r) map of neuronal activity (right) of cMNd. Correlation values were calculated relative to the prototroch (outlined). (F) Calcium-imaging trace of cMNd and the prototroch. (G) Correlation of GCaMP signals of cMN neurons with GCaMP signals measured from the prototroch ciliary band (CB). Data points represent measurements from different larvae, n > 12 larvae. Mean and standard deviation are shown. All sample medians are different from 0 with p-values≤0.0002 as determined by Wilcoxon Signed Rank Test.
DOI: http://dx.doi.org/10.7554/eLife.26000.021

