. 2017 May 16;6:e26000. doi: 10.7554/eLife.26000

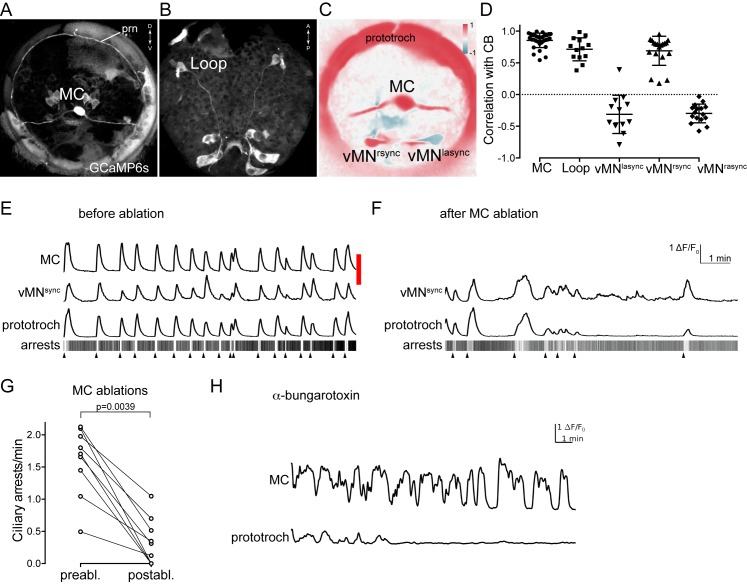
Figure 7. Activity of cholinergic neurons.

(A–B) GCaMP6s signal revealing cell morphologies of the active MC (anterior view) (A) and Loop (ventral/posterior view) (B) neurons in 2 days-post-fertilisation larvae. (C) Correlation (Pearson’s r) map of neuronal activity of the MC, vMNsync and vMNasync neurons. Correlation values were calculated relative to the prototroch. (D) Correlation of GCaMP signals of cholinergic neurons with GCaMP signals measured from the prototroch ciliary band (CB). Data points represent measurements from different larvae, n > 12 larvae. Mean and standard deviation are shown. All sample medians are different from 0 with p-values≤0.0034 as determined by Wilcoxon Signed Rank Test. (E–F) Effect of MC neuron ablation on prototroch activity and ciliary closures. Red bar represents the time of the ablation. GCaMP signals in the MC neuron, in a vMNsync neuron, and in the prototroch before (E) and after (F) MC neuron ablation. (G) Number of ciliary arrests in the prototroch before and after MC neuron ablation. (H) Calcium signals measured from the MC neuron and the prototroch following the addition of 50 µM alpha-bungarotoxin. Abbreviation: prn, prototroch ring nerve.

DOI: http://dx.doi.org/10.7554/eLife.26000.023

Figure 7—source data 1. Source data for Figure 7D with correlation values of neuronal activity.
DOI: 10.7554/eLife.26000.024
Figure 7—source data 2. Source data for Figure 7G with ciliary closures before and after MC neuron ablation.
DOI: 10.7554/eLife.26000.025

Figure 7.

Figure 7—figure supplement 1. Characterisation of MC neuron activity.

Figure 7—figure supplement 1.

(A) Normalised calcium signals in the MC neuron (n = 96 larvae). (B) Cycle length of MC neurons as determined by Fourier analysis of the traces shown in (A). (C) Frequency distribution of cycle length of MC neurons, same data as in panel (B).
Figure 7–figure supplement source data 1. Source data for Figure 7—figure supplement 1A with calcium imaging data of the MC neuron from 96 individual larvae.
The data are organized in rows. The first row is the time stamp (sec). These data are shown in 0–1 normalized form in Figure 7—figure supplement 1A.
elife-26000-fig1.csv (332.1KB, csv)
DOI: 10.7554/eLife.26000.027
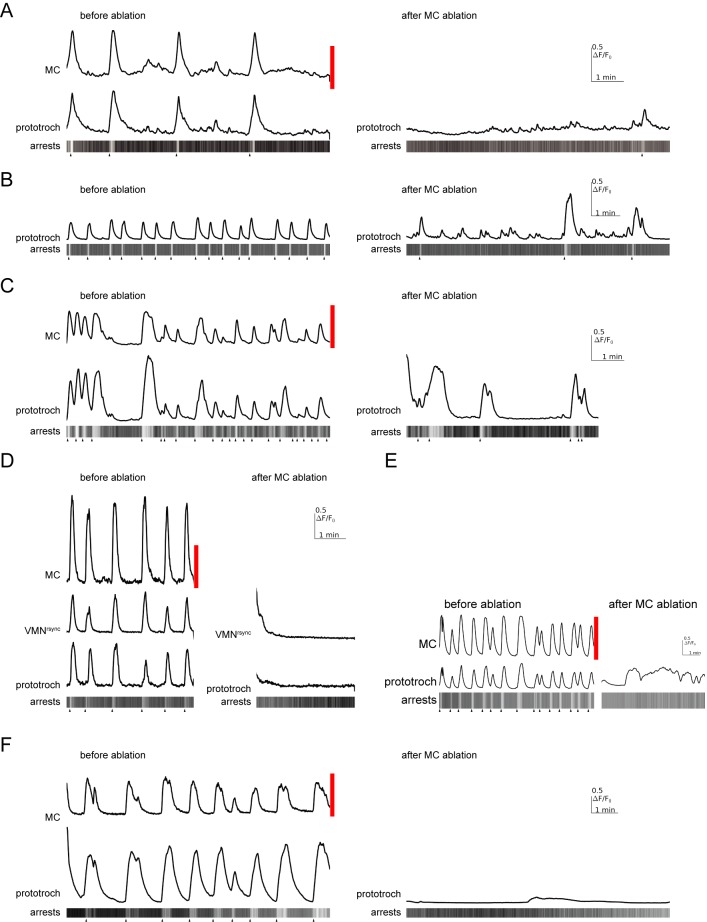
Figure 7—figure supplement 2. Effect of MC neuron ablation on prototroch activity and ciliary closures.

Figure 7—figure supplement 2.

(A–F) Calcium signals in the MC neuron, a vMNrsync neuron, and in the prototroch, before and after MC neuron ablation. Kymographs showing arrests of prototroch cilia are also shown. Arrowheads indicate the beginning of arrests. (A–F) show examples of MC neuron ablations in different larvae.