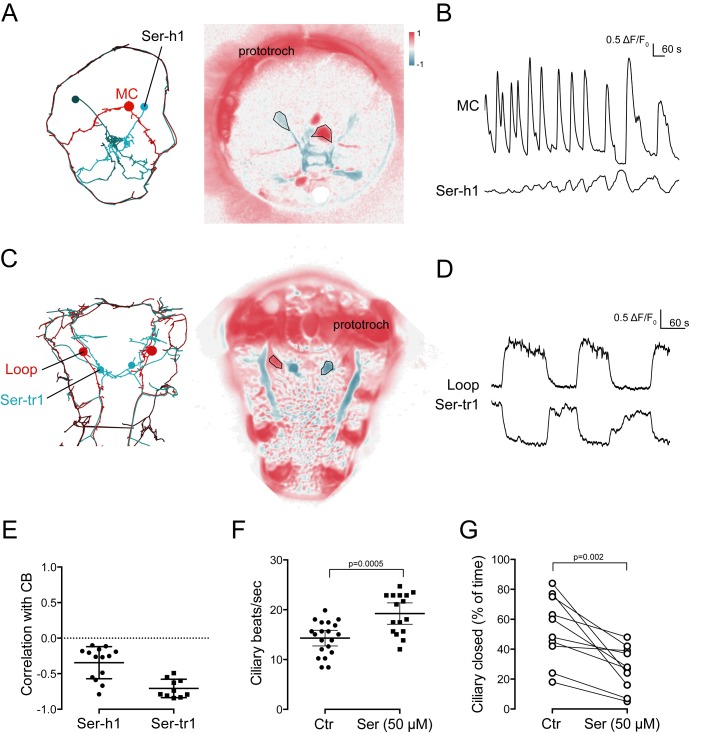
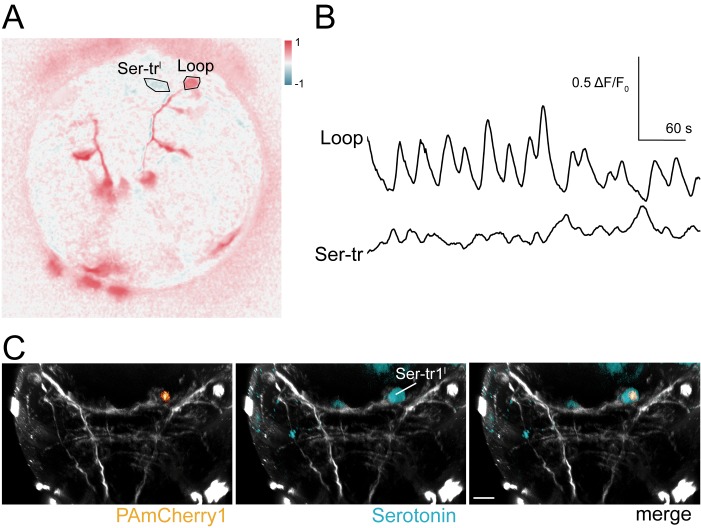
Figure 8. Activity of serotonergic neurons.
(A) ssTEM reconstruction (left) and correlation (Pearson’s r) map of neuronal activity (right) of the Ser-h1 neurons, anterior view. Correlation values were calculated relative to the prototroch. (B) Calcium signals measured from a Ser-h1 neuron and the MC cell. (C) ssTEM reconstruction (left) and neuronal activity correlation (right) of the Ser-tr1 neurons, ventral view. Correlation values were calculated relative to the prototroch. (D) Calcium signals measured from a Ser-tr1 neuron and a Loop neuron. (E) Correlation of GCaMP signals of serotonergic neurons with GCaMP signals measured from the prototroch ciliary band (CB). Data points represent measurements from different larvae, n > 9. Mean and standard deviation are shown. All sample medians are different from 0 with p-values≤0.002 as determined by Wilcoxon Signed Rank Test. (F) Ciliary beat frequency of prototroch cilia in the absence and presence of serotonin. (G) Ciliary closures of prototroch cilia in the absence and presence of serotonin. P-values of an unpaired (F) and paired (G) t-test are shown. In (F,G) n > 9 larvae. Samples in (F,G) passed the D'Agostino and Pearson omnibus normality test (alpha = 0.05).
DOI: http://dx.doi.org/10.7554/eLife.26000.030


