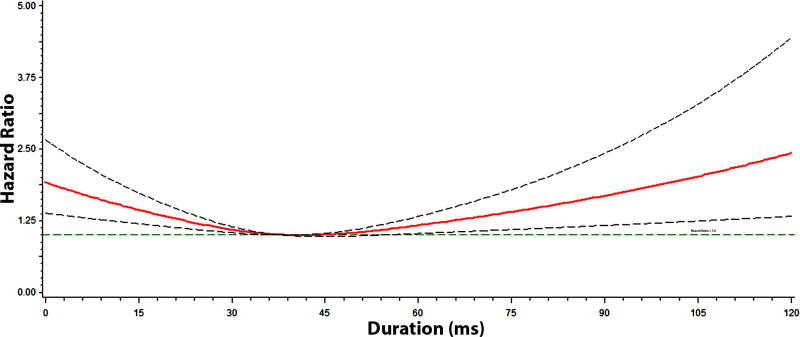
Figure 4. Risk of Atrial Fibrillation across P-wave Peak to P-wave End Duration*.
*Each hazard ratio was computed with the median P-wave peak to P-wave end value of 38 ms as the reference, and was adjusted for age, sex, race, body mass index, heart rate, systolic blood pressure, smoking, diabetes, low-density lipoprotein cholesterol, coronary heart disease, and heart failure. Dotted-lines represent the 95% confidence interval.

