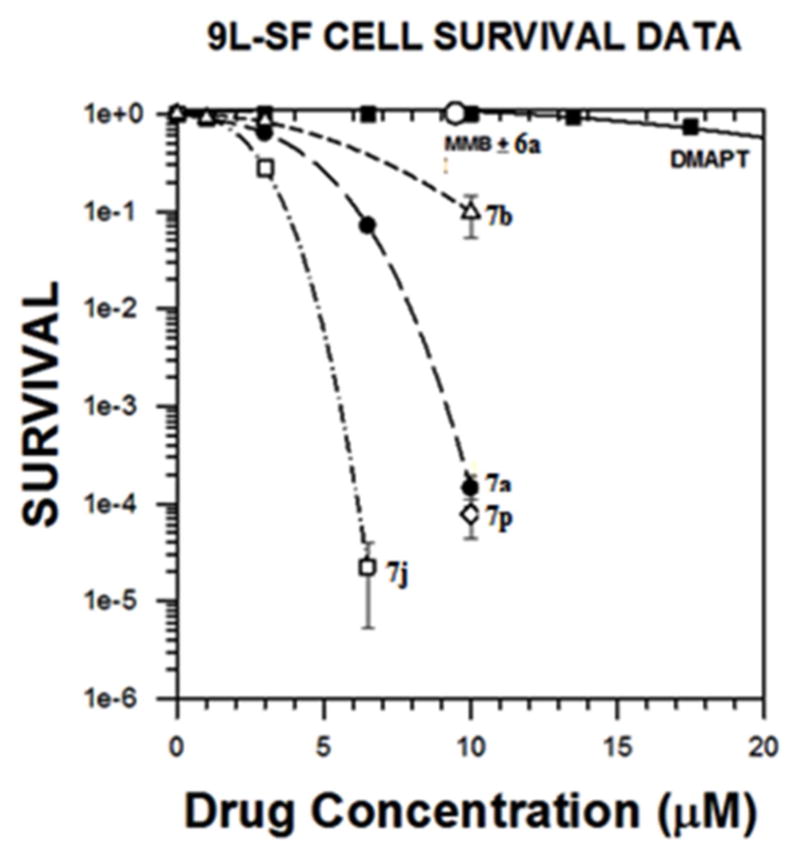
Fig 4.

Dose-response Curves for Compounds 7a, 7b, 3+6a, 7p, 7j and DMAPT against rat gliosarcoma cells (9L-SF): cell survival as a function of drug concentration for cells treated for 48 h with the indicated drug. Each datum point represents the mean plus standard error of the mean for three experiments.
