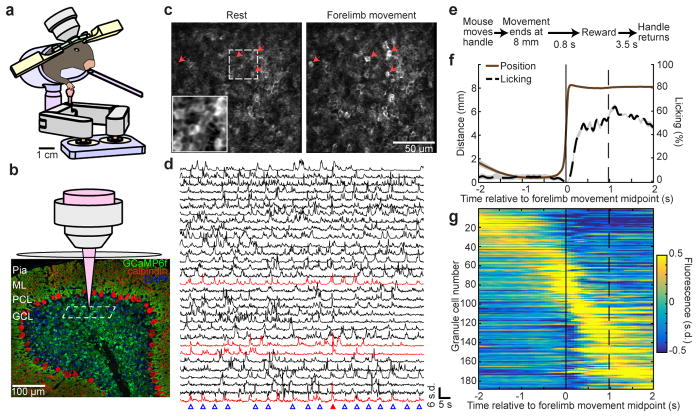
Figure 1. Two-photon Ca2+ imaging of cerebellar granule cells during an operant task.
a, Mice voluntarily pushed a manipulandum forward for sucrose water reward. We performed Ca2+ imaging while recording the paw position and the mouse’s licking. b, Confocal image of the cerebellar cortex of a transgenic mouse expressing GCaMP6f in granule cells. Calbindin immunostain for Purkinje cells in red. ML, molecular layer; PCL, Purkinje cell layer; GCL, granule cell layer. Two-photon imaging plane is schematized (dashed white box). c, Example in vivo two-photon images of cerebellar granule cells at rest and during a forelimb movement (500-ms average). Arrows denote example granule cells exhibiting fluorescence increases during this forelimb movement. Inset shows magnified view of mean fluorescence signals. d, Each row depicts the Ca2+ trace over time of one granule cell from the image in c. Blue triangles indicate forelimb movements. Red traces correspond to cells with red arrows in c. Red triangle denotes forelimb movement shown in c. Cells are ordered according to Extended Data Fig. 1c. e, Task structure. See Extended Data Fig. 3f for an alternative condition. f, Trial-averaged forelimb movement and licking (68 trials from an example mouse). Solid and dashed vertical lines denote midpoint of forelimb movement and average time of reward, respectively. g, Each row shows the trial-averaged Ca2+ response of a single neuron, with colors representing fluorescence signal in the unit of standard deviation (s.d.) from the mean (188 cells from three sessions in lobules VIa, VIb, and simplex from the mouse in f.). In this and all subsequent figures, shaded regions denote s.e.m.

