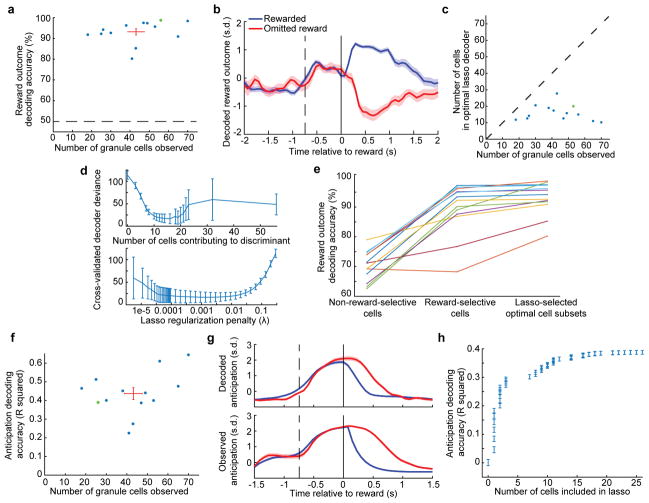
Extended Data Fig. 7. Granule cell ensembles discriminate reward outcome and decode behavior.
a, We sought to discriminate reward from omitted reward trials by linearly decoding ensemble granule cell activity. We first used lasso logistic regression to identify the minimal set of neurons that achieve optimal decoding accuracy for each imaging session. For this minimal set, we fit a linear discriminant to the mean fluorescence from 0 to 1 s of each cell on each trial. We tabulated the discriminant’s cross-validated accuracy for each imaging session (dots). Red bars denote mean ± s.e.m. across sessions (n = 13 experiments in 6 mice; Methods). Dashed line denotes chance accuracy. Green dot denotes example session used in (b) and (d). b, For an example imaging session, we applied the discriminant weighting to the time-varying cellular responses on each trial and averaged the output across all rewarded and omitted reward trials (n = 56 neurons, 64 rewarded trials, 19 omitted reward trials). The large separation following reward vs reward omission reflects accurate neural decoding. c, In general, the lasso determined that optimal cross-validated decoding was achieved with a minority of recorded cells. d, For the example session shown in b, we examined how cross-validated reward outcome decoding accuracy varied with the number of neurons included in the decoder, by varying the lasso penalty. We found that optimal performance was achieved with a subset of cells, indicating that larger groups of cells resulted in some overfitting (Methods). Error bars indicate s.e.m. from cross-validation. e, To determine the importance of reward-selective cells in decoding, we fit linear discriminants while excluding reward-selective cells (> 0.2 s.d. absolute fluorescence difference between reward conditions averaged from 0.1 to 1 s), as well as discriminants using only reward selective cells. We compared these decoders’ performance to the optimal subset determined from lasso regression, and found that reward-selective cells recover most of the optimal decoder performance. Each line represents one imaging session (n = 13 sessions). f, We reasoned that if granule cells can signal the mouse’s reward anticipation, it should be possible to use neuronal activity to decode this anticipation on a moment-by-moment basis. We therefore defined the mouse’s instantaneous anticipation state to be its lick rate (in 200 ms bins) until it received reward, in which case we defined anticipation to decline to zero (Methods). For each imaging session, we performed a linear regression to approximate the mouse’s time-varying reward anticipation behavior by using the time-varying fluorescence of all cells. We quantified regression performance as the R2 fraction of variance in reward anticipation that was accounted for by the regression output (using cross-validation). Each dot denotes a single imaging session. Red bars denote average decoder performance. Green dot denotes example session used in (g, h). g, For one example session, concurrence between decoded anticipation (top) and observed anticipation according to the definition in f (bottom), from a single imaging session averaged across all rewarded (blue) and omitted reward trials (red) (n = 26 neurons, 171 rewarded trials, 54 omitted reward trials). h, For the example session in e, we performed a lasso regression that penalizes non-zero weights on cells, to restrict the number of cells used for decoding. We varied the penalty from zero to maximum in order to determine how accuracy scales with the number cells (Methods). Reward anticipation decoding accuracy (using cross-validation) reached nearly asymptotic levels with typically ~10–20 included neurons. Error bars indicate s.e.m. from cross-validation.

