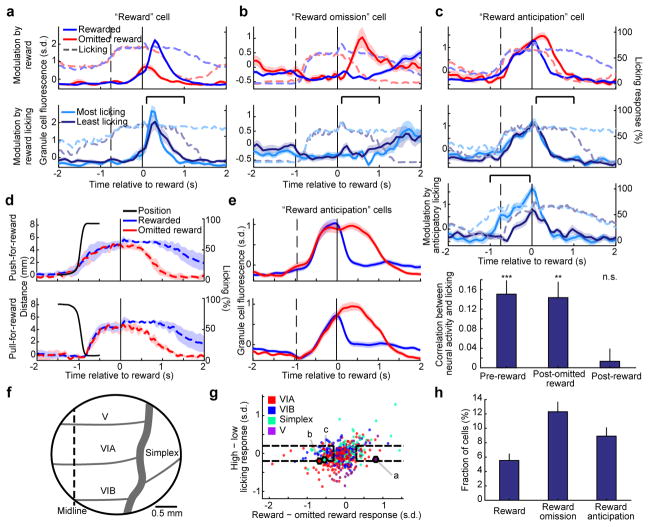
Figure 2. Granule cells encode reward context during a forelimb movement operant task.
a–c, Trial averaged Ca2+ response (solid traces) of three example granule cells, superimposed on licking traces (dashed). Solid and dashed vertical lines denote reward onset and midpoint of forelimb movement, respectively. First row compares rewarded trials and omitted reward trials (trial numbers in a–c, 228, 97, 171 rewarded and 77, 25, 54 omitted reward, respectively). Second row compares rewarded trials with the most or least licking in response to reward delivery (25 of each in the bracketed period). c, Third row compares trials with the most or least anticipatory licking (25 of each in the bracketed period). Fourth row shows the relationship between licking and activity of all reward anticipation neurons. Bars denote the Spearman correlation between fluorescence response and licking either prior to reward delivery (−1 to −0.05 s), or following omitted reward or reward delivery (0.1 to 0.6 s). *** p = 8×10⁻⁶ pre-reward; ** p = 5×10⁻⁴ post-omitted reward; n.s. p = 0.59 post-reward (Wilcoxon signed-rank test; n = 50 reward anticipation neurons from 6 mice). d,e, In a modified task where mice alternated pushing-for-reward (top) with pulling-for-reward (bottom) trials, forelimb movement and licking responses are indicated as solid and dashed lines, respectively (d). Reward anticipation neurons classified on pushing trials (e, top) maintain similar responses on pulling trials (e, bottom), average of 41 neurons from 4 mice. f, Illustration of 3 mm cranial window. Grey lines represent cerebellar lobule boundaries. g, For each granule cell recorded during the (pushing only) operant task, we quantified the reward vs. reward omission response preference (x-axis; mean fluorescence response difference from 0.1 to 1 s), and the licking response preference (y-axis; mean response difference between trials with the most and least reward licking from 0.1 to 1 s; n = 6 mice, 561 cells). Colors denote lobule origin of the cells. Dashed boxes indicate neurons we classified as selective for reward or omitted reward, with minimal licking sensitivity. Example cells from a–c are outlined. h, Prevalence of reward, reward omission, and reward anticipation neurons. Reward omission excludes reward anticipation neurons.

