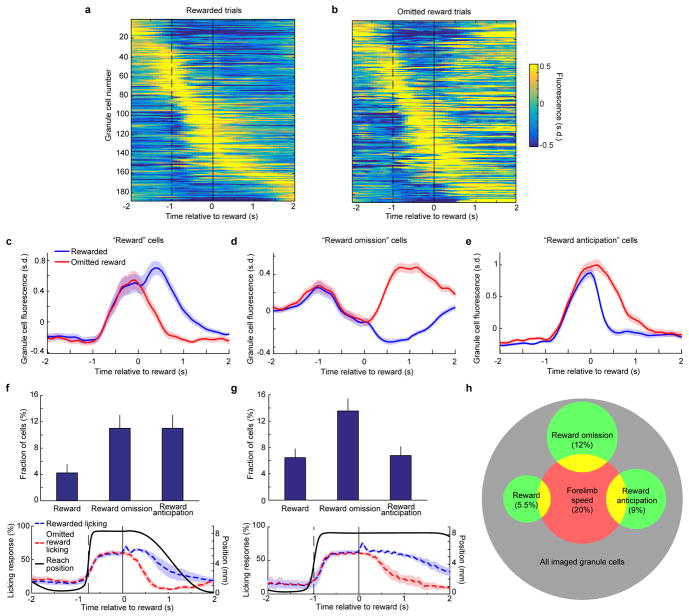
Extended Data Fig. 3. Granule cell reward responses during the operant task.
a, b, Fluorescence response of all granule cells recorded from three experiments in lobules VIa, VIb, and simplex from one example mouse on rewarded trials and omitted reward trials. Each row shows the trial-averaged response of a single neuron. Dashed vertical line denotes the average forelimb movement midpoint; solid vertical line denotes time of reward delivery. Many more neurons appear to respond preferentially following omitted reward than reward delivery (n = 188 neurons). c–e, Average reward-aligned fluorescence of all reward-preferring cells (c), omitted reward-preferring cells (d), and reward anticipation cells (e), from all mice and lobules during forelimb movements (n = 31 reward cells, 69 reward omission cells, 50 reward anticipation cells from 13 forelimb movement sessions in 6 mice). See Methods for cell identification criteria. f, g, Comparison of the cohort of mice that performed the operant task with briefer delay periods (f, n = 6 experiments in 3 mice with delay between the end of forelimb movement and reward delivery = 0.6 s and delay between reward delivery and manipulandum handle return = 2 s), or longer delay periods (g, n = 7 experiments in 3 mice with reward delay = 0.8 s and post-reward delay = 3.5 s). Top, prevalence of reward response types as fraction of total neurons (error bars denote counting error). Bottom, average movement and licking behavior across mice on each task version. Results did not differ substantially between the two task versions and thus all data were pooled for all analyses aside from these figure panels. Across all mice, 50% of peak licking rise from baseline was reached in anticipation 0.8 ± 0.04 s before reward. Licking was prolonged following reward compared to omitted reward (p = 4×10⁻⁴ Wilcoxon rank sum test, n = 6 mice; licking declined to half of its anticipatory level by 1.4 ± 0.14 s following reward compared to 0.7 ± 0.08 s following omitted reward). h, Venn diagram illustrating multiplexed representations in granule cells. Relative areas are true to observed cell proportions. Corresponding counting errors for reward-related cell classifications are provided in Fig. 2h. For forelimb speed cells, counting error was 1.7%. The prevalence of multiple representations in a granule cell matched predictions of independent probabilities of each representation (1.1% of cells encode reward and forelimb speed, 2% encode reward omission and forelimb speed, and 2.3% encode reward anticipation and forelimb speed, compared to the independence null hypothesis of 1.1%, 2.4%, and 1.8%, respectively).

