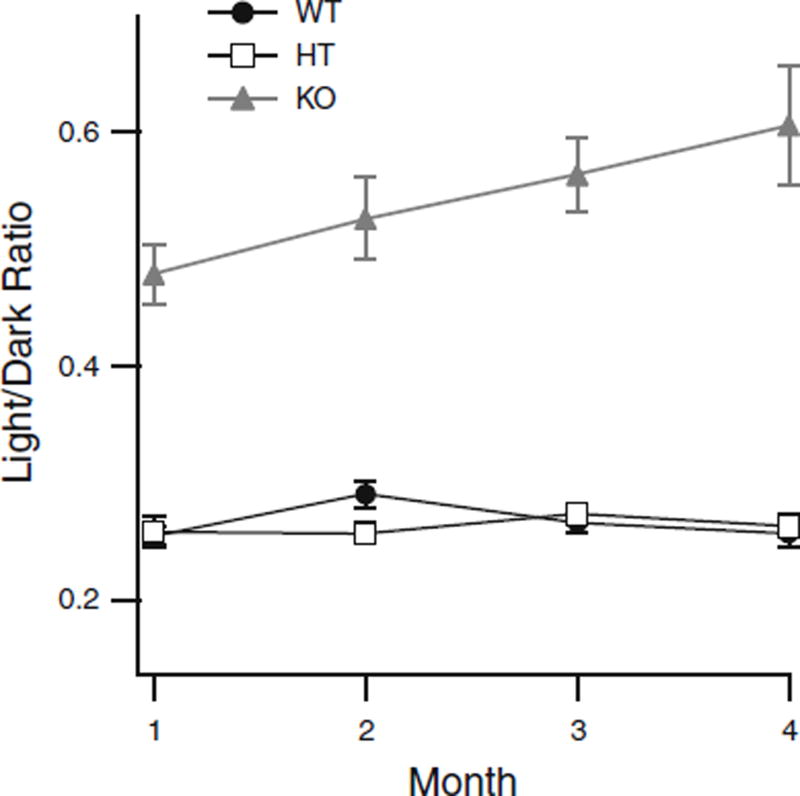
Fig. 5.
Ratio of light- to dark-adapted b-wave amplitudes plotted as a function of age for: knockout (KO; n = 11, filled gray triangles), wild-type (WT; n = 12, filled circles), and heterozygous (HT; n = 12, open squares) mice (Error bars = mean ± SEM, where bars are absent error falls within symbol)

