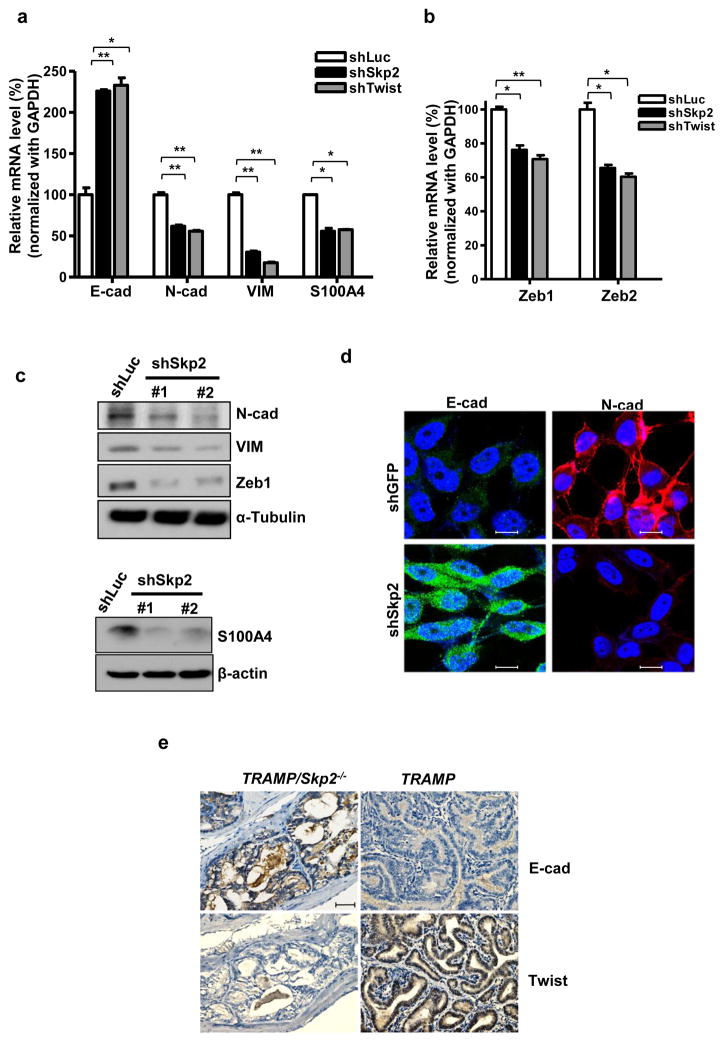
Figure 5. Skp2 recapitulates Twist’s effect on EMT in CRPC cells.
(a, b) Real-time PCR analysis of epithelial marker E-cadherin (E-cad), mesenchymal markers N-cadherin (N-cad), Vimentin (VIM), S100A4 (a) and EMT regulators Zeb1 and Zeb2 (b) in PC3 cells with luciferase, Skp2 or Twist silencing. Quantified results are presented as means ± SD; *, p < 0.05 and **, p < 0.01. (c) Western blot analysis of EMT markers in PC3 cells with luciferase or Skp2 knockdown. (d) Immunofluorescence (IF) staining for E-cadherin and N-cadherin in PC3 cells with GFP or Skp2 knockdown. Scale bar represents 10 μm. (e) Representative images of histological analyses of Twist and E-cadherin protein expression in prostate tumors/tissues isolated from TRAMP/Skp2−/− and TRAMP mice. Scale bar, 100 μm.

