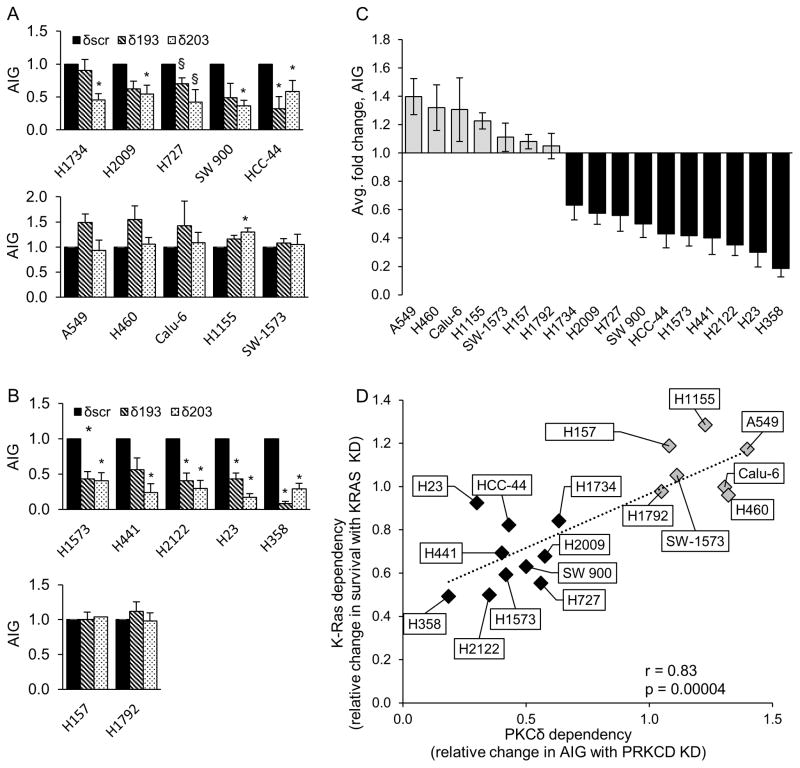
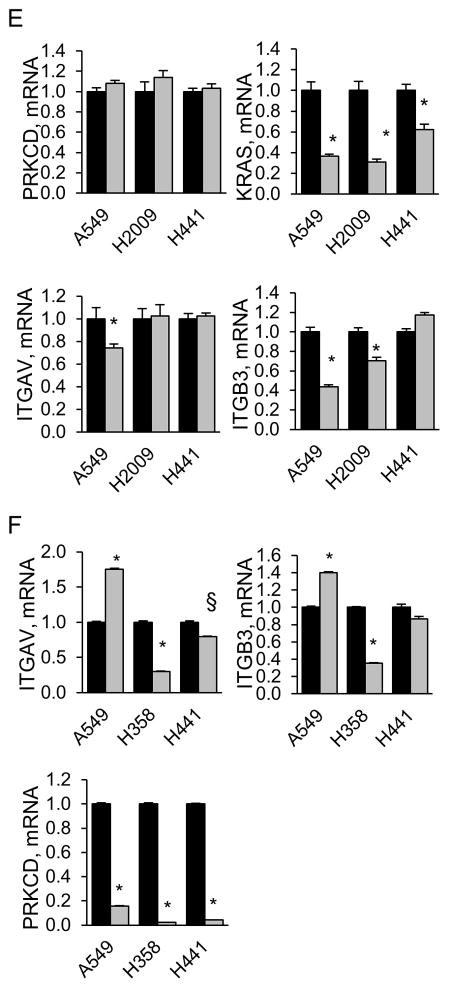
Figure 1. K-Ras dependent NSCLC cells require PKCδ for survival.
Control NSCLC cells (δscr=solid bars), and cells expressing PKCδ shRNA (δ193=diagonal bars, δ203=dotted bars), were assayed for anchorage independent growth (AIG) as described in Materials and Methods; (A) K-Ras dependent and (B), K-Ras independent cell lines. Graphs represent the average of 3 or more experiments +/− SEM; * = p < 0.05 and § = p < 0.09 as determined by Student’s 2 tailed t-test. (C) Relative change in AIG in K-Ras independent (gray bars) and K-Ras dependent (black bars) NSCLC cell lines with depletion of PKCδ. For each cell line, AIG in δscr cells was set as one; PKCδ dependency is expressed as the average relative change in AIG in δ193 and δ203 cells. Data represents the average of 3 or more experiments +/− SEM. (D) Linear regression was performed between K-Ras and PKCδ dependency. K-Ras dependency is the relative change in survival with depletion of K-Ras (see Figure S1) and PKCδ dependency is the relative change in AIG growth with depletion of PKCδ (see Figure 1C). Three or more experiments were averaged for each data point. Pearson correlation r=0.83, p=0.0004. (E) q-RT PCR for ITGAV, ITGB3, PRKCD and KRAS was performed on the indicated cells following transient depletion with either lentiviral KRAS shrna (gray bars) or a control lentivirus (black bars). For each cell line, control cells were set as one and fold change is represented. Graphs represent the average of 2–3 experiments +/− SEM; * = p < 0.05. (F) q-RT PCR for ITGAV, ITGB3 and PRKCD was performed on indicated NSCLC lines stably depleted of PKCδ (δ193, gray bars) or a δscr control (black bars). For each cell line, δscr cells were set as one and fold change is represented. Graphs represent the average of 2–3 experiments +/− SEM; * = p < 0.05 and § = p < 0.09.


