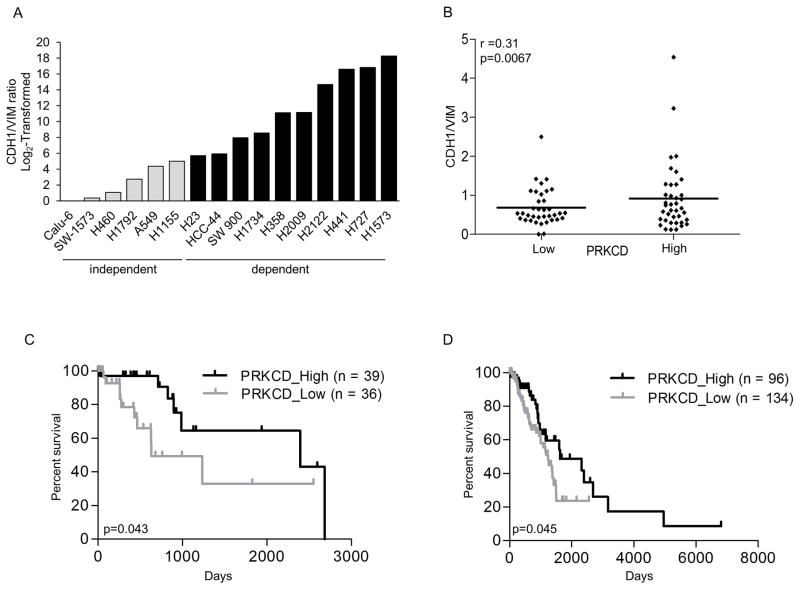
Figure 5. High PKCδ expression correlates with markers of epithelial differentiation and predicts increased patient survival.
(A) CDH1/VIM mRNA expression ratio of K-Ras independent (gray bars) and K-Ras dependent (black bars) NSCLC cell lines (see Material and Methods). Data shown was normalized to the lowest value (Calu-6) and log2-transformed. (B) KRAS mutant lung adenocarcinomas in the TCGA database were binned into PKCδ high (mRNA expression > median) and PKCδ low (mRNA expression < median). Graph shows CDH1/VIM mRNA ratio in PKCδ low versus PKCδ high mRNA expression. (C) Kaplan-Meier curve of patients with KRAS mutant lung adenocarcinomas stratified by high (black line) and low (gray line) PKCδ mRNA expression. (D) Kaplan-Meier curve of patients with lung adenocarcinomas stratified by high (black line) and low (gray line) PKCδ mRNA expression.

