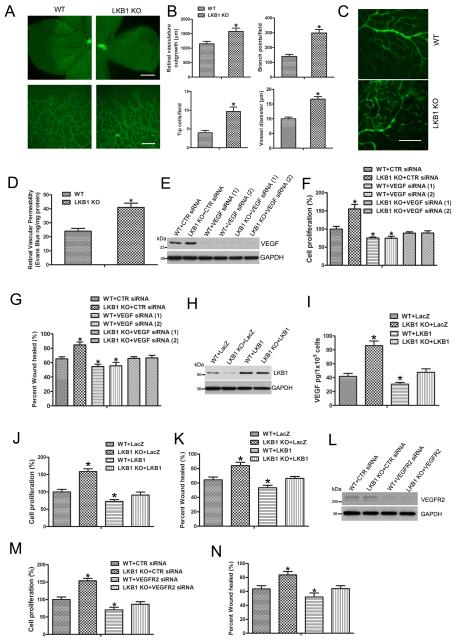
Figure 5. Increased endothelial angiogenesis with LKB1 deletion.
A, Mouse retinal vasculature observed by staining with fluorescein-isolectin B4 on postnatal day 6. Upper bar = 500 μm. Lower bar = 100 μm. B, Vascularization, branch points, tip cell numbers and vessel diameter. *, P < 0.05, compared with WT (n = 5). C, WT and LKB1endo−/− mice were injected with 70-kDa FITC-dextran via the tail vein and retinas were mounted on slides. Bar = 100 μm. D, Retinal vascular permeability measured by the Evans blue method. *, P < 0.05, compared with WT (n = 5). E, Western blot analysis of VEGF level in ECs transfected with control (CTR) siRNA or two independent VEGF siRNA for 3 days. F, Cell proliferation assayed by ELISA measuring the rate of BrdU incorporation at 450 nm after VEGF was silenced. *, P< 0.05, compared with WT +CTR siRNA (n = 5). G, Cell migration analysis for 16 hr. *, P< 0.05, compared with WT+CTR siRNA (n = 5). H, Western blot analysis of LKB1 level in mouse ECs transfected with LacZ or LKB1 plasmids for 2 days. (I) VEGF levels were measured from cell medium after transfection. Cell proliferation (J) and migration (K). *, P< 0.05, compared with WT +LacZ (n = 5). L, Western blot analysis of VEGFR2 in WT or LKB1endo−/− ECs transfected with CTR or VEGFR2 siRNA for 2 days. Cell proliferation (M) and migration (N). *, P< 0.05, compared with WT +CTR siRNA (n = 5). Data are mean ± SE.

