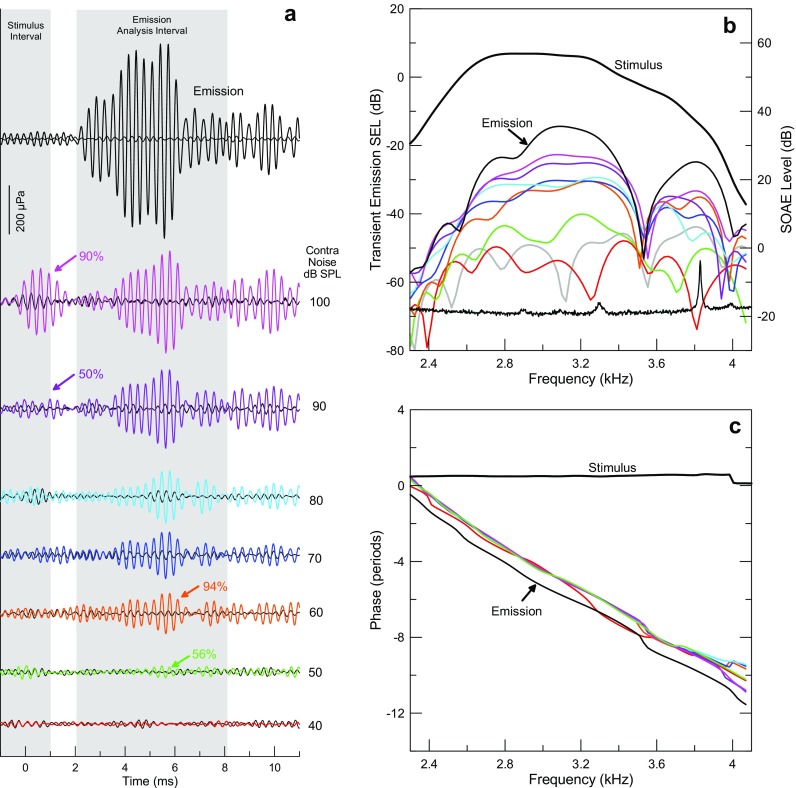
FIG. 5.
Results from one participant (#28RF) illustrate the raw data. a Time waveforms of the TEOAE residual in response to 3 kHz tone pips at 50 dB peSPL (70 dB peSPL reference) (black plots at the top) and changes induced by different levels of contralateral noise are coded by color and the noise level is shown to the right of each plot. The 2-ms-wide shaded area centered on 0 ms represents the duration of the tone pip stimulus. The 6-ms-wide window centered on 5.1 ms represents the time window used to analyze the TEOAE and ΔP TEOAE. The thresholds for activating the MEMR and MOCR are 90 and 50 dB SPL contralateral noise as indicated by the purple and green arrows, respectively. Reproducibility, indicated above the arrows, exceeded 50 % at these and higher noise levels. b Spectral analysis of the time waveforms in panel a. The stimulus spectrum is also represented. The noise floor for the 40-dB SPL contralateral level is indicated as the gray curve. The spectral average at the bottom shows spontaneous emissions in this ear (level shown on the right y-axis). c The similarity in the slopes of the phase for the TEOAE and ΔP TEOAE reveals a similar group delay. The phase of the TEOAE has been shifted down by one period for comparison with phase of ΔP TEOAE.

